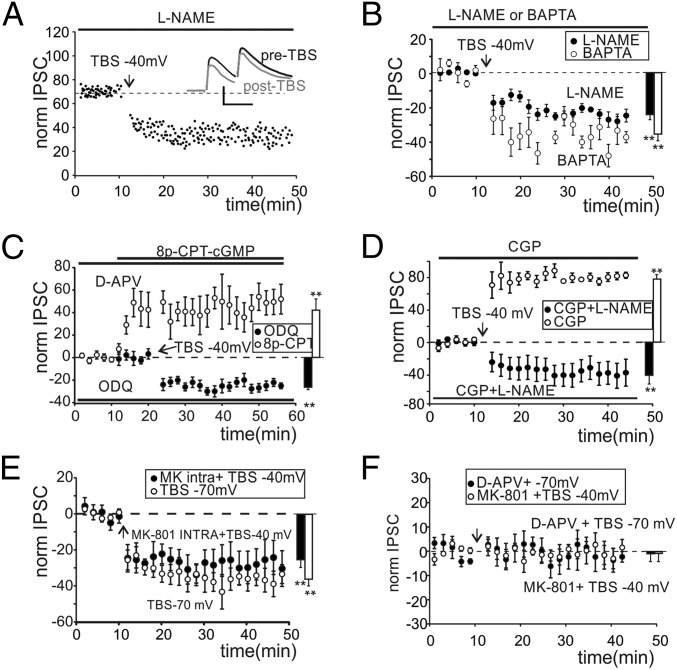
Fig. 3.
Properties of LTPGABA and LTDGABA. (A) Time course of IPSCs first peak amplitude in a GrC incubated and perfused with l-NAME (horizontal bar). Traces in the Inset show average responses before (black) and after (gray) TBS. (Scale bar: 40 pA, 20 ms.) (B) Time course of normalized IPSC changes obtained from cells incubated and perfused with l-NAME (●) and cells recorded with high intracellular BAPTA (○). Histogram shows average IPSC changes (● −21.9 ± 3.9%, n = 7, **P < 0.01; ○ −37.1 ± 4.3%, n = 4, **P < 0.01). (C) Time course of normalized IPSC changes obtained from cells incubated (more than 2 h) and perfused with ODQ (●) and cells incubated and perfused with d-APV and transiently perfused with 8p-CPT-cGMP (○). Histogram shows average IPSC changes (● −24.7 ± 2.2%, n = 4, **P < 0.01; ○ +41.5 ± 13.4%, n = 4, **P < 0.01). (D) Time course of normalized IPSC changes obtained from cells perfused with CGP and l-NAME (●) and cells perfused with only CGP (○). Histogram shows average IPSC changes (● −44.1 ± 10.4%, n = 5, P < 0.01; ○ +78.4 ± 3.1%, n = 5, P < 0.01). (E) Time course of normalized IPSC changes obtained from cells with intracellular MK-801 (●) and cells receiving TBS at −70 mV (○). Histogram shows average IPSC changes (● −25.5 ± 6.1%, n = 5, **P < 0.01; ○ −35.9 ± 10.3%, n = 6, **P < 0.01) (F) Time course of normalized IPSC changes obtained with TBS at −70 mV and in the presence of d-APV (●) and cells with extracellular MK-801 and TBS at −40 mV (○). Histogram shows average IPSC changes (● −1.3 ± 4.2%, n = 5, P > 0.7; ○ −1.1 ± 3.7%, n = 4, P > 0.6).

