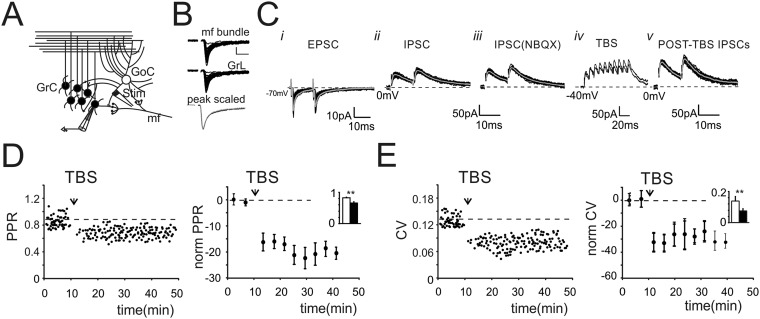
Fig. S2.
The impact of GABAergic inhibition on granule cell neurotransmission. (A) Schematic drawing of the granular layer microcircuit. The stimulating electrode (stim) was positioned in the granular layer to directly stimulate GoC axon and mf terminals. (B) EPSCs evoked by positioning the stimulating electrode across mf bundle (Top: peak 31.4 ± 4.8pA, PPR 0.7 ± 0.06, n = 21) or in the granular layer (Middle: peak, 29.1 ± 2.7 pA, PPR 0.7 ± 0.05; n = 33). Average traces obtained after peak normalization (Bottom) show that EPSCs had similar kinetics. (C) Scheme of the experimental protocol. (i) EPSCs recorded from a GrC voltage clamped at −70 mV (black, 20 traces superimposed; gray, average EPSC). (ii) IPSCs obtained from the same cell by clamping GrC at 0 mV. IPSCs showed an average first peak amplitude of 53.4 ± 5.5 pA and current kinetics (r10–90 2.6 ± 0.3 ms; τ 21.3 ± 1.1; n = 43). (iii) IPSCs recorded in the presence of NBQX to eliminate IPSCs activated by disynaptic pathway and eventual residual AMPA currents. Monosynaptic IPSCs showed an average first peak amplitude of 56.5 ± 4.9 pA (n = 32) and a PPR of 0.81 ± 0.04 (n = 32) without significant differences from control solution (P < 0.4). (Current kinetics r10–90 1.7 ± 0.4 ms; τ 19.2 ± 0.7 n = 43). (iv) TBS was delivered while voltage clamping GrC at −40 mV. Traces show two 100-Hz bursts superimposed. (v) Monosynaptic IPSCs recorded post-TBS showed an average first peak amplitude of 80.4 ± 7.7 pA (n = 32). (D, Left) Time course of PPR of IPSCs taken from the same cell shown in Fig. 2A. (Right) Time course of normalized PPR changes (n = 18). Histogram in the Inset shows average PPR before (black) and after (white) TBS (0.083 ± 0.03 vs. 0.65 ± 0.04 n = 18; **P < 0.001). (E, Left) Time course of CV of IPSCs taken from the same cell shown in C. (Right) Time course of normalized CV changes (n = 18). Histogram in the Inset shows average values of CV before and after TBS (0.14 ± 0.03 vs. 0.07 ± 0.01 n = 18; **P < 0.01).

