Fig. S3.
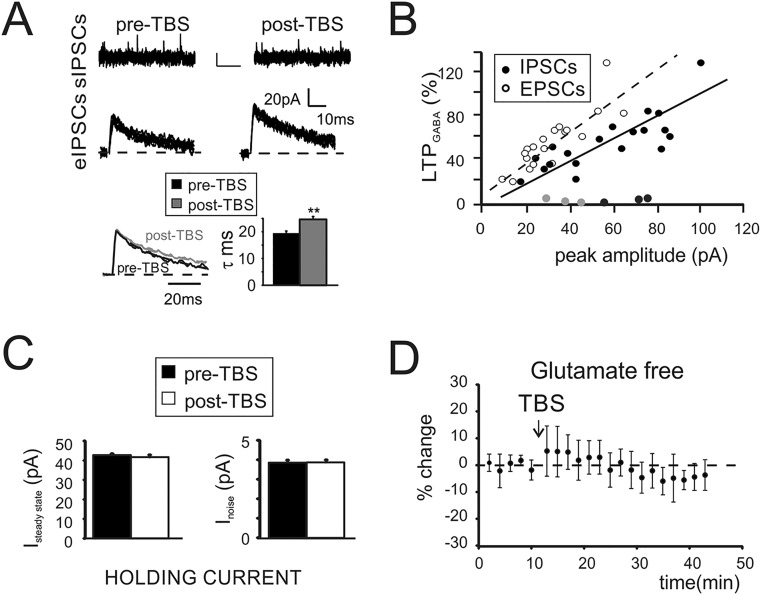
Properties of LTPGABA. (A, Top) Traces showing sIPSCs before and after TBS. (Scale bar: 10 pA, 500 ms.) sIPSC peak 18.6 ± 0.4 pA, n = 900 events vs. 23.5 ± 0.3 pA, n = 900 events; P < 0.01; frequency +0.5 ± 3.5%, n = 18; P > 0.6. (Middle) Traces show a comparison between monosynaptic IPSCs evoked by single stimuli before and after TBS (20 traces superimposed). (Bottom) Normalized traces obtained from the averaging of Upper traces (black pre-TBS, gray post-TBS). Note the longer decay of post-TBS trace. Histogram summarizes average values of IPSCs decay (**P < 0.01). (B) Relationship between EPSC (●) and IPSC (○) peak amplitude with the amount of LTPGABA. In three cells (EPSCs, light gray and IPSCs, dark gray), no significant changes were observed in response to TBS. (C) Histograms show changes of the steady state (Left) and of the peak-to-peak noise (Right) of the holding current recorded at 0 mV in response to TBS (n = 18 cells). (D) Time course of IPSCs peak amplitude obtained from cells in which the stimulation did not evoke glutamatergic responses (n = 6).

