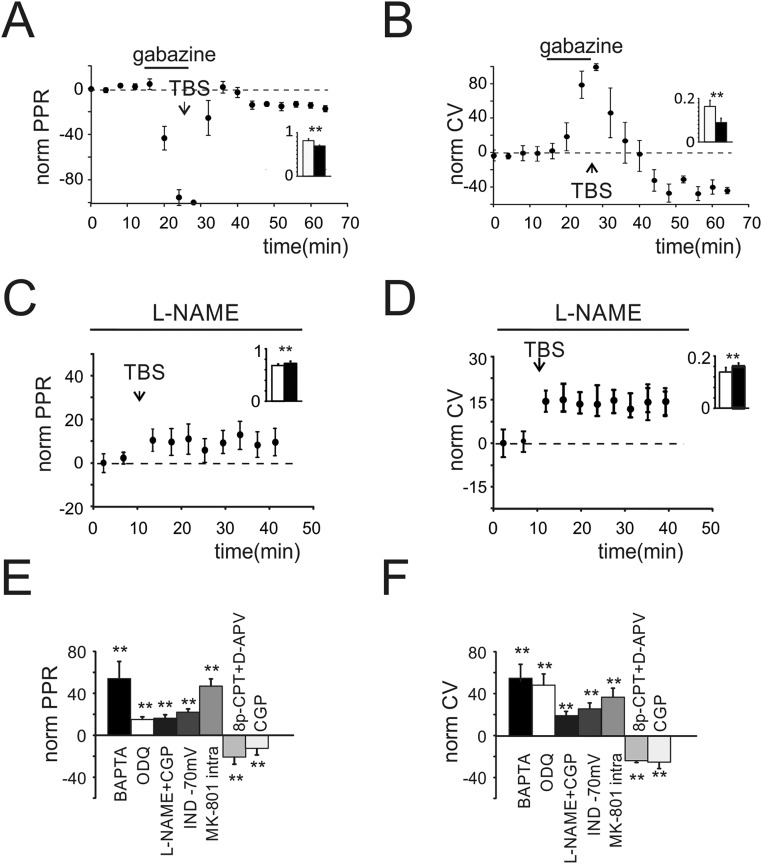
Fig. S4.
Properties of LTPGABA. (A) Time course of normalized PPR obtained from cells transiently perfused with gabazine (n = 7). Histogram in the Inset shows average PPR before (black) and after (white) TBS (0.81 ± 0.04 vs. 0.69 ± 0.03 n = 7; **P < 0.01). (B) Time course of normalized CV in cells transiently perfused with gabazine (n = 7). Histogram in the Inset shows average values of CV before and after TBS (0.16 ± 0.04 vs. 0.08 ± 0.03 n = 7; **P < 0.01). (C) Time course of normalized PPR (n = 7) obtained when slices were incubated and perfused with l-NAME (10.8 ± 1.3%; n = 7, P < 0.01). Histogram in the Inset shows average PPR before (black) and after (white) TBS (0.7 ± 0.04 vs. 0.78 ± 0.03 n = 7; **P < 0.01). (D) Time course of normalized CV (n = 7) obtained when slices were incubated and perfused with l-NAME (15.5 ± 3.4%; n = 7; P < 0.01). Histogram in the Inset shows average CV before (black) and after (white) TBS (0.17 ± 0.02 vs. 0.2 ± 0.03 n = 7; **P < 0.01). (E) Histogram of PPR changes measured in different experimental conditions. (F) Histogram of CV changes measured in different experimental conditions (**P < 0.01).

