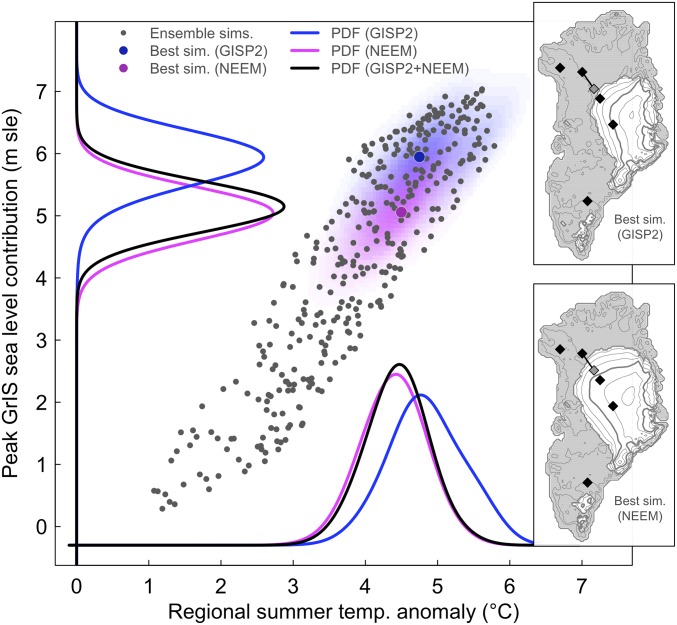
Fig. 5.
Simulated maximum GrIS contribution to sea level (m sle) vs. the peak regional summer temperature anomaly (°C) during the Eemian (black points). Background shading shows the 2D marginal probabilities for GISP2 (blue) and NEEM (magenta) estimated using a weighted kernel density estimate. Probabilities projected onto each variable are shown along with the combined (GISP2 + NEEM) estimate. Insets show the minimum ice sheet distribution for the best simulation for GISP2 (Upper) and NEEM (Lower). The black diamonds on the ice sheet indicate drilling sites, and correspond to sites in Fig. 1. The gray diamond connected to the NEEM point is the estimated upstream deposition site for Eemian age ice.

