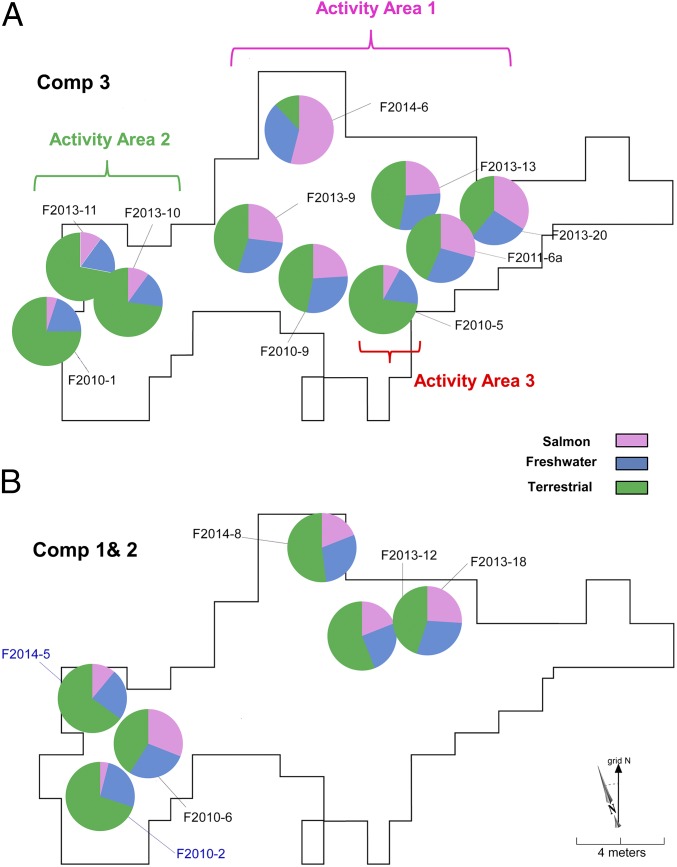
Fig. 4.
The proportional contribution of three different food groups (terrestrial, freshwater, and salmon) to hearths in component 3 (A) and components 1 and 2 (B) in USR site. The pie chart represents mean values of the proportional contribution in case of multiple measured hearths and the contribution of hearth F2010-09 is estimated mean value based on only bulk δ15N values. Three hearths (F2014-06, F2013-20, and F2013-09) in component 3 (≥45%) and one hearth (F2010-06) in component 2 (31%) have the highest contribution of salmon. There are three distinct activity areas in component 3: (i) salmon processing/disposal in hearths, (ii), terrestrial mammal processing/disposal, and (iii) both mammal and salmon processing at the indoor hearth F2010-05.

