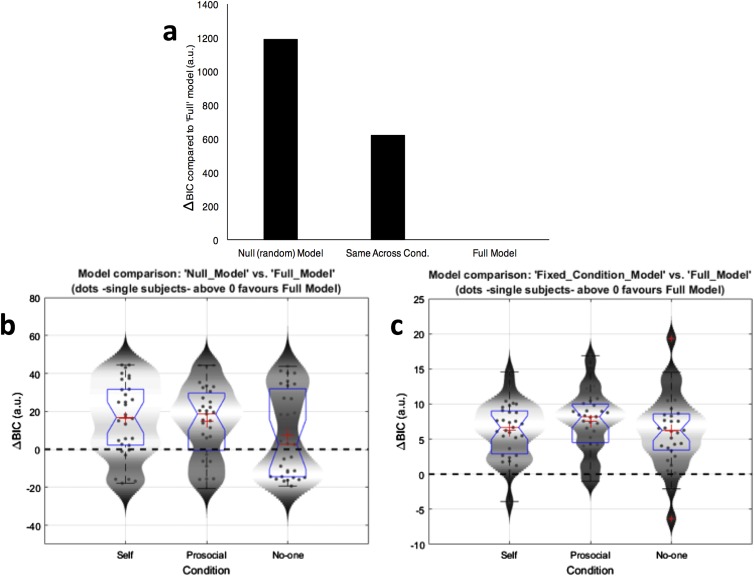
Fig. S2.
Bayesian model comparison results. (A) Results of Bayesian model comparison (natural log scale) using the Bayesian information criterion (BIC), showing decisive evidence in favor of the full model (delta BIC > 10), which includes separate α and β parameters for each condition. (B and C) The BIC score was evaluated for each model/condition and subtracted from the full RL model BIC score for each participant. Values greater than zero indicate that the full RL model was better at describing the behavior of the participant than the null model (B) or the model with fixed parameters across conditions (C) (score above 2 suggests positive evidence in favor of the full RL model, whereas a score above 10 indicates decisive evidence). Box plots (blue) represent the distribution of BIC scores for each condition (median is indicated by the red vertical line, whereas the mean is denoted by the large red cross). Upper and lower whiskers denote the highest and lowest datum within 1.5 IQR of the upper and lower quartile (data points beyond this range are marked by small red crosses). Violin plots (shaded gray area) represent the smoothed distribution of the data.

