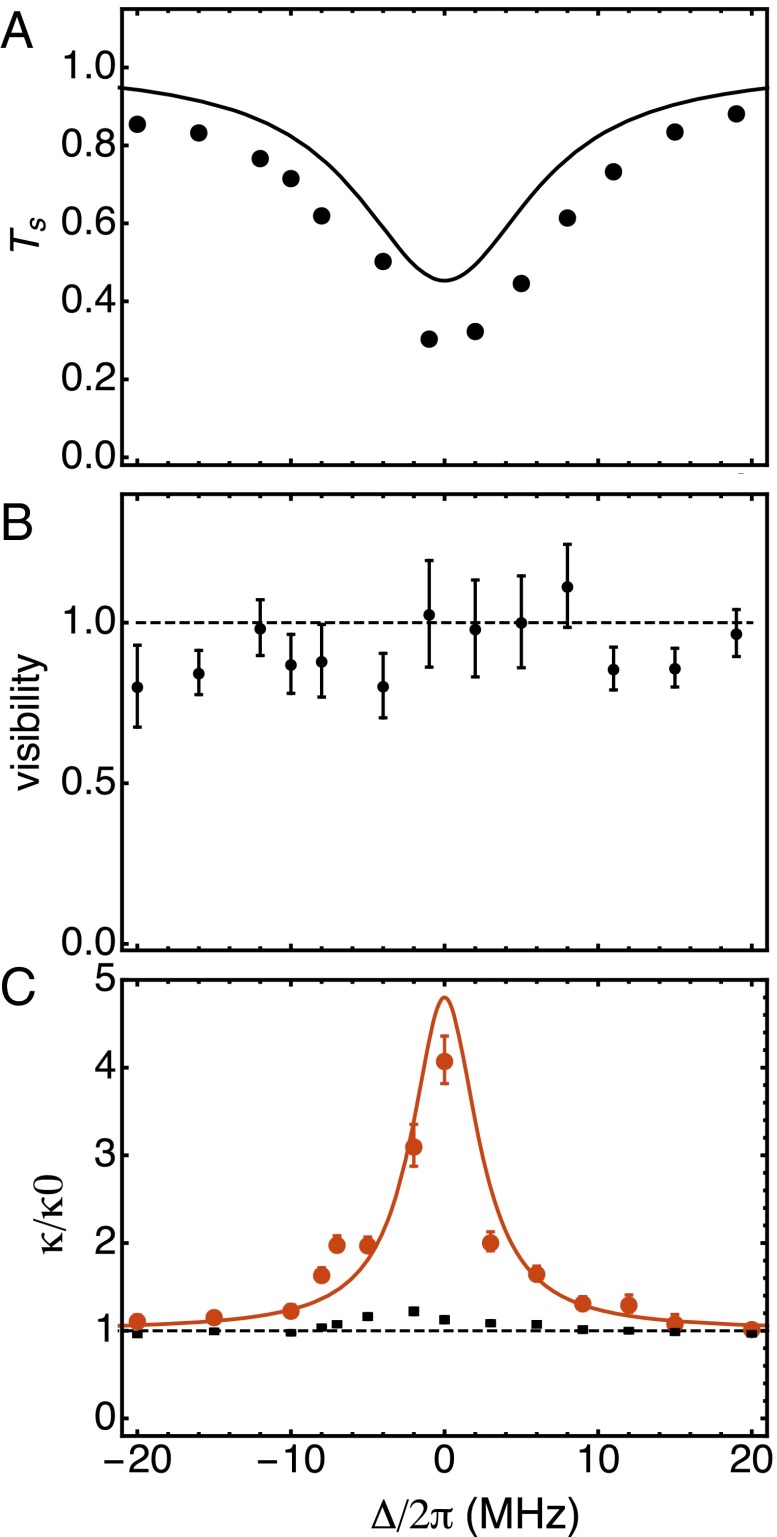
Fig. 3.
Signal transmission, signal visibility, and cavity linewidth. (A) The fractional signal transmission conditioned on detecting a control photon (black circles), measured at and . The solid line is the theoretical expectation accounting only for scattering of control light. The discrepancy is discussed in the text. (B) Fringe visibility of recovered signal light after correction for the signal loss shown in A, which is the dominant contrast loss mechanism. The data are consistent with no contrast loss from other effects (dashed line). (C) The cavity linewidth conditioned on detecting a signal photon (red circles) and averaged cavity linewidth (black squares), normalized to the bare linewidth kHz, measured for .

