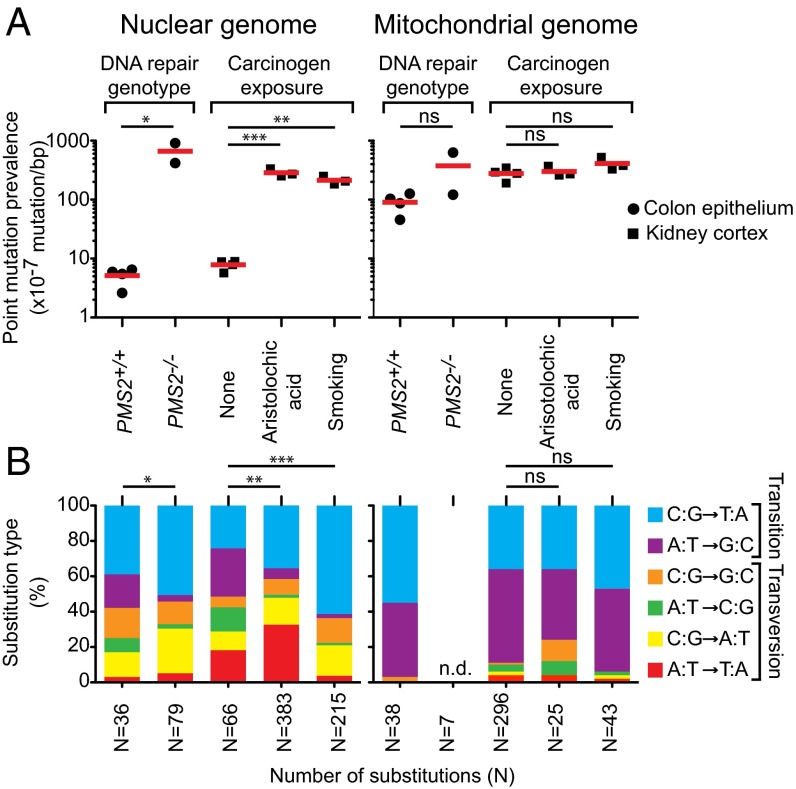
Fig. 2.
Nuclear point mutations increase in normal tissues from individuals with defects in DNA repair or with exposure to environmental carcinogens compared with controls. (A) Comparison of point mutation prevalences in nuclear (Left) and mitochondrial (Right) genome in age-matched normal colon epithelium (filled circle) with different DNA mismatch repair genotypes (PMS2+/+ or PMS2−/−) or in age-matched normal kidney cortex (filled square) without (none) or with (aristolochic acid or smoking) carcinogen exposure. Red lines represent average. *P < 0.05, t test; **P < 0.001 and ***P < 0.0001, one-way ANOVA with Bonferroni multiple comparison posttest; ns, not significant, indicates P > 0.05. (B) Stacked columns representing the substitution frequencies (y axis) of each substitution out of the six possible types (see legend). Cohort labels are indicated in A directly above each column. Number of substitutions (N) generating each mutational spectrum is indicated on the x axis. n.d., not determined due to an insufficient number of mutations (N = 7) for mutational spectrum analysis. *P = 0.04, Fisher’s exact test; **P = 2.6 × 10⁻⁸ and ***P = 1.5 × 10⁻¹⁶, Fisher’s exact test with Bonferroni multiple comparison correction; ns, not significant, indicates P > 0.05. All statistical tests in this figure were two-tailed.

