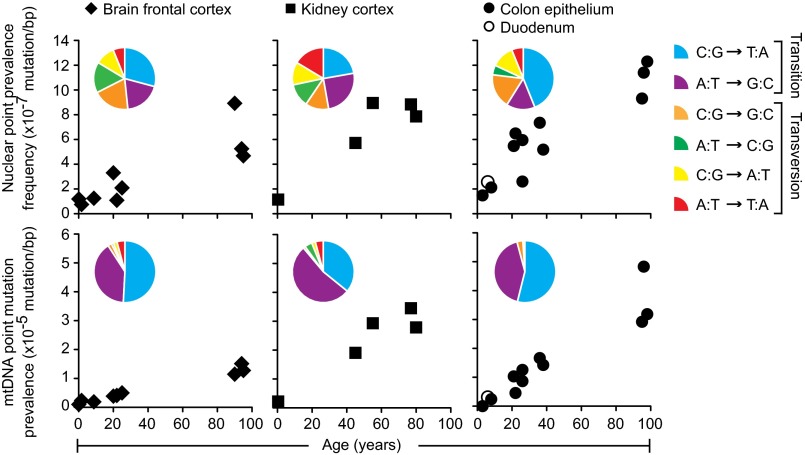
Fig. 3.
Normal human tissues accumulate point mutations over a lifetime with genome-specific and tissue-specific mutational patterns. Point mutation prevalences in nuclear (Top) and mitochondrial (Bottom) genome measured in four normal tissue types (brain frontal cortex of 9 individuals, kidney cortex of 5 individuals, colon epithelium of 11 individuals, and duodenum of 1 individual). Twenty-six total individuals were assessed, with each individual contributing to one normal tissue type. Pie chart Insets show the prevalences of each substitution out of the six possible substitution types (see pie chart legend, right side). Each pie chart was compiled from the individuals represented in their respective scatter plots, with the exception that duodenum was omitted. The number of substitutions generating the pie charts for the nuclear genome was n = 31 for brain, n = 73 for kidney, and n = 94 for colon, and for the mitochondrial genome was n = 181 for brain, n = 299 for kidney, and n = 116 for colon.

