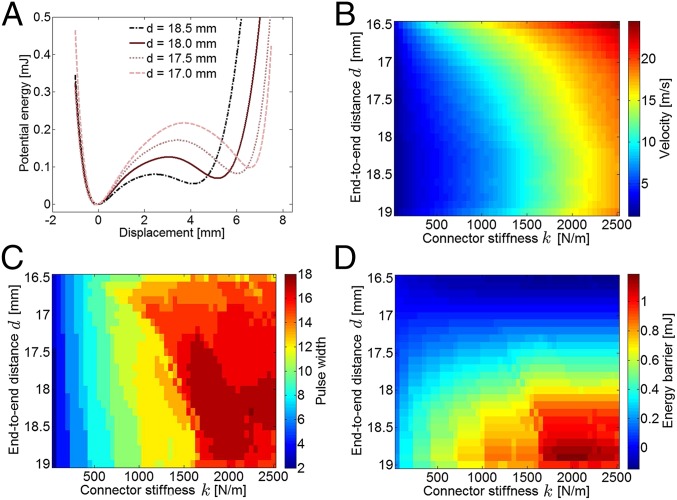
Fig. 3.
(A) The on-site potential as a function of x and d, as determined via quasistatic 1D displacement-controlled simulations of an individual bistable element. Simulated values of (B) pulse velocity and (C) pulse width as a function of end-to-end distance d and connector stiffness k. (D) The measured energy landscape (A) of the individual bistable elements is combined with the simulated pulse widths (C) to compute an approximate energy barrier for the entire propagating pulse (a function of both d and k).

