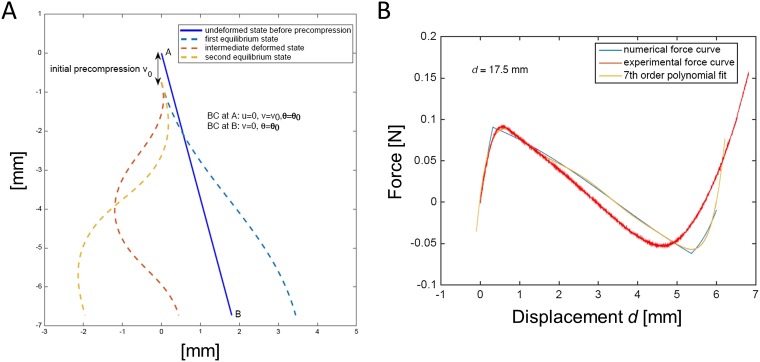
Fig. S3.
(A) An example of the beam deformation simulation is shown. All simulations were performed on only one half of the bistable element (i.e., on one tilted beam). Different configurations of the beam are shown as it is displaced from one stable configuration to another. The force at node B is measured (and doubled to account for bistable element consisting of two tilted beams). (B) The numerical, experimental, and best-fit force–displacement curves are shown for mm. The graphics indicate that experimental and numerical results are in good agreement.

