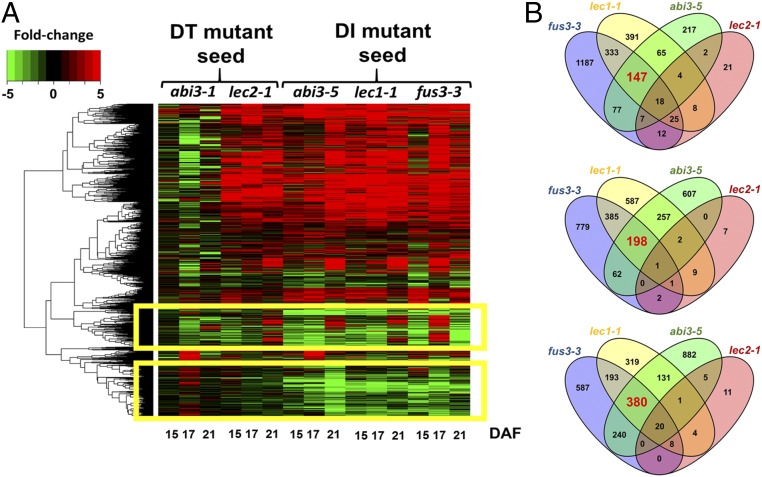
Fig. 1.
Global gene expression profile in seed desiccation-intolerant mutants. (A) Heat map from hierarchical clustering of differentially expressed genes. Each mutant was compared with its corresponding wild type (lec1-1 and lec2-1 versus Ws; abi3-5 versus Ler; fus3-3 versus Col-0) at three developmental stages, 15, 17, and 21 DAF. Green indicates down-regulated values, red indicates up-regulated values, and black indicates unchanged values. The yellow rectangles indicate the common down-regulated genes between intolerant mutants. DI, desiccation-intolerant; DT, desiccation-tolerant. (B) Venn diagrams showing the number and distribution of differential genes across the comparison among mutants representing down-regulated genes at 15, 17, and 21 DAF. Genes potentially related to desiccation tolerance are indicated in red.

