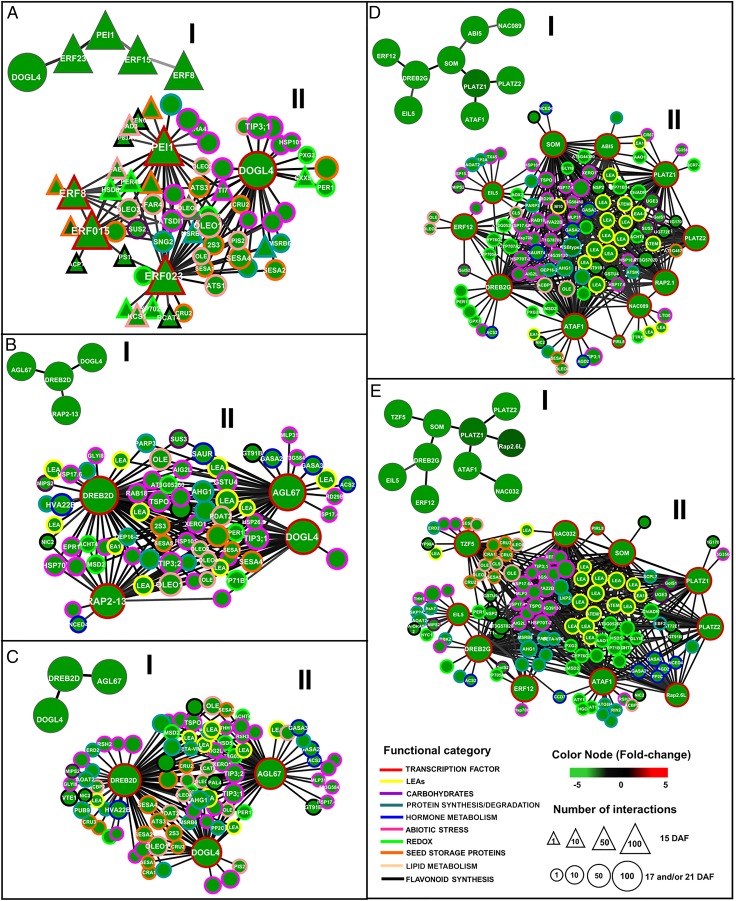
Fig. 3.
ARACNe-inferred coexpression networks for genes involved in the acquisition of desiccation tolerance. “I” graphs represent TFsSeed-subNetDT1 or TFsSeed-subNetDT2 at data processing inequality (DPI) 0.0, and “II” graphs represent the interactions of transcription factors in II and nontranscription factors from FullSeedNet. (A–C) Graphs correspond to genes for TFsSeed-subNetDT1 involved in nutrient storage and stress tolerance at 15 (A), 17 (B), and 21 DAF (C). (D and E) Graphs correspond to genes for TFsSeed-subNetDT2 involved mainly in cellular protection mechanisms at 17 and 21 DAF. TFsSeed-subNetDT2 is not yet present at 15 DAF. Genes are represented as nodes and inferred interactions are represented as edges. Network attributes are presented in the information box. Nodes with a triangular shape represent genes that are expressed only at 15 DAF, and circles represent genes that are expressed at least at two of the sampled stages. Node borders represent functional categories (see Datasets S13 and S15 for details). Edge width and color intensity are proportional to the mutual information value of the interaction, with higher MI values corresponding to thicker and darker edges. I represent the TFs that act as major nodes at each stage of the integration of the regulatory networks and II represents the same TFs with all the putative target genes of each node.

