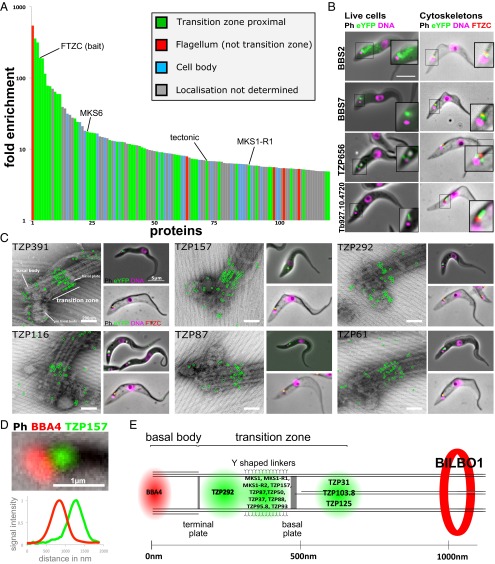
Fig. 2.
TZ subdomains defined by protein localization. (A) The localization of the proteins more than fivefold enriched in the IP-bound fraction is indicated by the color of each bar. All TZ proximal (green, includes the TZPs) and flagellum proteins (red) were verified by protein tagging. Cell body (blue) localization was judged either on protein tagging (this study) or likely localization based on known protein function. Localization not determined (gray) includes proteins where protein tagging did not give a convincing localization and proteins that were not tagged. (B) Fluorescence imaging of cell lines expressing tagged BBS2, BBS7, TZP656, and Tb927.10.4720 as live cells or as cytoskeletons stained with anti-FTZC. (C) The position of six TZPs was determined using immunogold labeling and TEM of whole cytoskeletons (Left) and fluorescence imaging of live cells (Top Right) or as cytoskeletons stained with anti-FTZC (Bottom Right). (D) Representative example of a flagellum stained with BBA4 isolated from cells expressing tagged TZP157. (E) The distance between eYFP and BBA4 signals was used to calculate protein localization within the TZ, based on the positioning of structural features as seen by EM.

