Fig. 5.
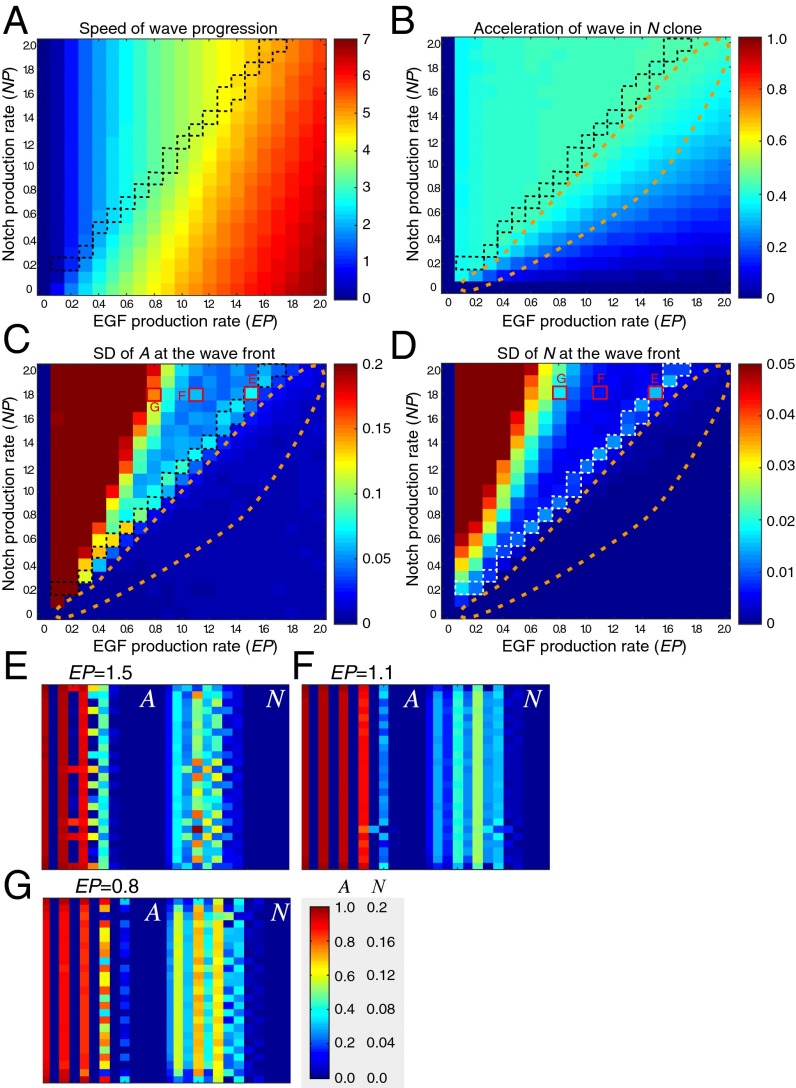
Phase diagrams of the four-component model. Results of in silico experiments in the absence of the feedbacks (ee = ne = ed = 0). (A) Speed of wave progression, (B) acceleration of wave in Notch clone, and (C and D) SDs of A and N at the wave front, respectively, were examined by changing NP (dt = dc = 0.25 × NP) and EP (ae = EP). Orange dotted lines indicate the area in which NP and EP are equivalent, showing wave acceleration in N clone without showing salt and pepper patterns in A and N. White and black dotted lines indicate the area in which NP is relatively larger or EP is relatively smaller showing salt and pepper patterns in A and N. The red rectangles indicate the conditions shown in E–G. (E–G) Salt and pepper and striped patterns of A and N at the wave front by changing the value of EP (NP = 1.8). (E) EP = 1.5, (F) EP = 1.1, and (G) EP = 0.8.

