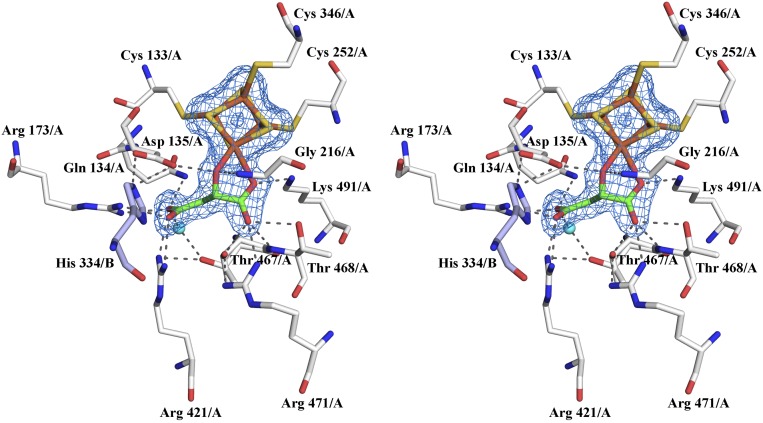
Fig. S4.
Stereoview of LmFH-2 active site. The residues of chains A and B are shown in white and light blue, respectively. The substrate S-malate, [4Fe-4S] cluster, and water molecule are shown in green, yellow (S) and orange (Fe), and cyan, respectively. Mesh represents the final 2Fo–Fc electron density map contoured at 1.5 σ level (blue) for S-malate and [4Fe-4S] cluster.

