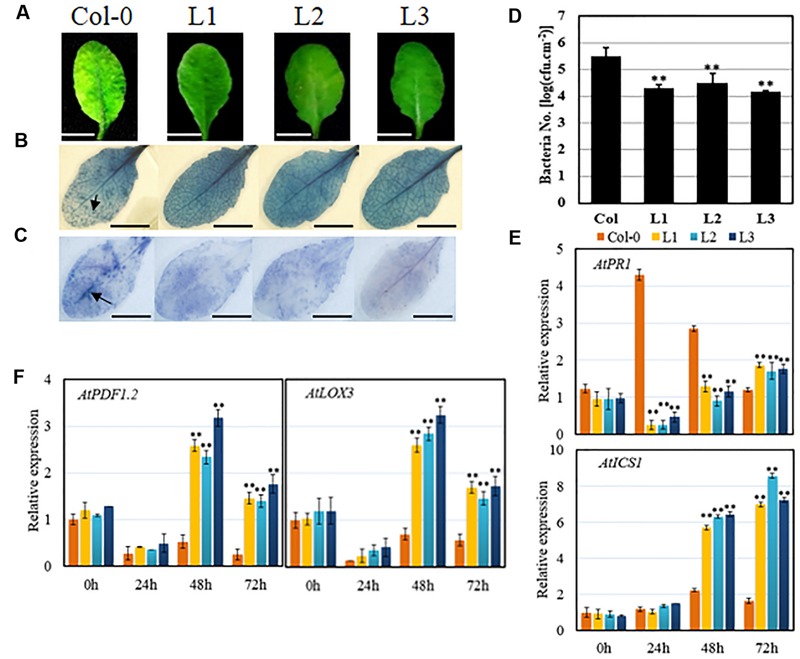
FIGURE 4.

Performance of VqSTS21 transgenic Arabidopsis lines and untransformed controls following inoculation with Pst DC3000 and expression of defense-related genes. Transgenic lines (L1, L2, and L3) and untransformed controls (Col-0) were infected with Pst DC3000. (A) Representative images of disease symptoms at 3 days post-inoculation (dpi). (B) Cell death and superoxide anion (C) were detected by trypan blue and nitro blue tetrazolium (NBT) staining, respectively, at 3 dpi, as noted by arrows. (D) Bacterial population assays were performed at 3 dpi. (E,F) Relative expression levels of defense-related genes in leaves collected 0, 24, 48, and 72 h post-inoculation (hpi) as established via qPCR. Data represent mean values ± SD (with values from time point 0 hpi set to 1) from three independent experiments. Asterisks indicate significant differences between Col-0 and transgenic lines as determined by Student’s t-test (∗∗P < 0.01). Scale bars = 10 mm.
