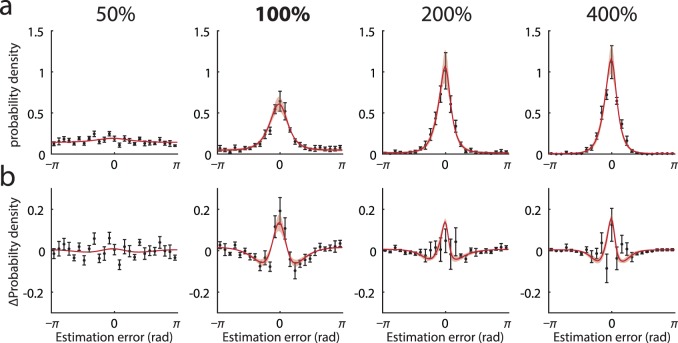
Figure 2.
Human estimation errors and model fits. (a) Black symbols show mean distribution of experimental estimation errors (error bars indicate ±1 SE). Different panels correspond to different contrasts, 50%–400% of detection threshold. Note presence of long tails in error distribution at detection threshold (100%). Red curves show mean error distributions for the population coding model with ML parameters (light red patches indicate ±1 SE). (b) Deviation from the circular normal distribution. Black symbols plot mean discrepancy between experimental error frequencies shown in (a) and circular normal (Von Mises) distributions matched in mean and variance. Red curves plot equivalent deviations for the population coding model with ML parameters.

