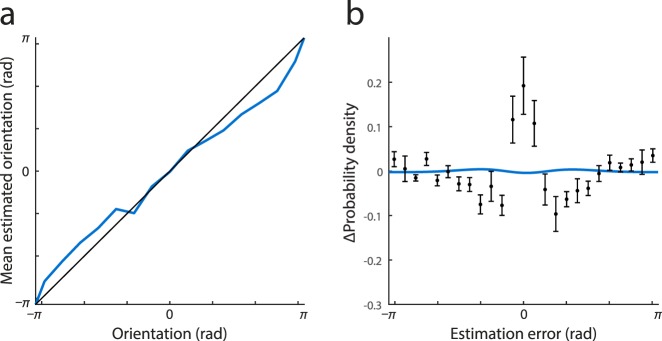
Figure 5.
Impact of response biases. (a) Mean estimated orientation at threshold contrast as a function of the true orientation of the stimulus. Black line indicates equality. (b) Blue curve plots estimated deviations from normality resulting from observed orientation biases. Black data points show actual deviations from normality replotted from Figure 2.

