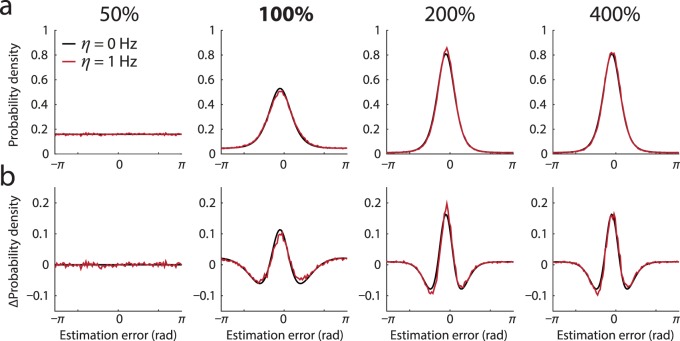
Figure 6.
Background (baseline) activity. Black curves show predictions of the population coding model with no baseline activity for a typical observer. Red curves plot predictions of the model with 1 Hz baseline activity, based on model parameters γ and κ fit to the no-baseline distributions. Note that with appropriate parameters, the 1 Hz baseline model closely reproduces predictions of the no-baseline model. (a) Error distribution. (b) Deviation from circular normal.

