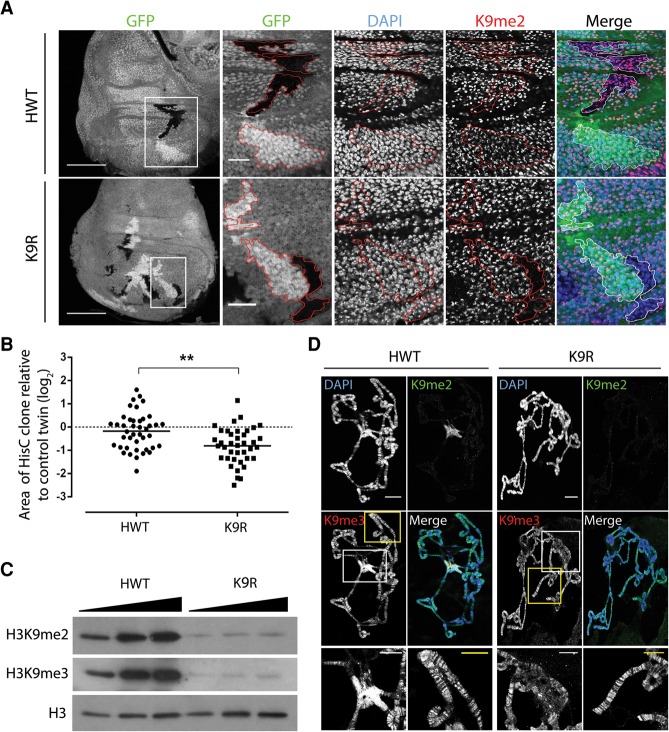
Figure 1.
H3K9R mutant cells proliferate with severely reduced H3K9me2 and me3 in pericentric heterochromatin. (A) Twin spot analysis of FLP–FRT-induced mitotic clones of HisC deletion wing disc cells rescued with an HWT transgene (top) or a K9R transgene (bottom). Wing discs were stained with DAPI to mark nuclei, anti-H3K9me2 to identify K9R cells, and anti-GFP to identify twin spots, (red lines). HisC deletion cells lack GFP, and control sister clones are homozygous HisC+ and express 2× GFP. Bar, 1000 µm. White boxes indicate magnified regions where the bar represents 20 µm. (B) Quantification of twin spot clone area. Each dot represents the area of the experimental (HWT or K9R) clone divided by the area of the control twin spot clone. (**) P < 0.005. (C) Western blot analysis of total cellular histone isolated from whole third instar larvae. (D) Polytene chromosome preparations from third instar larval salivary glands stained with DAPI and anti-H3K9me antibodies. Bar, 20 µm. Magnified images show H3K9me3 staining at the chromocenter (white box) and chromosome arms (yellow box). Bar, 10 µm. Note that H3K9me3 signal at the chromocenter is overexposed to reveal staining on chromosome arms.

