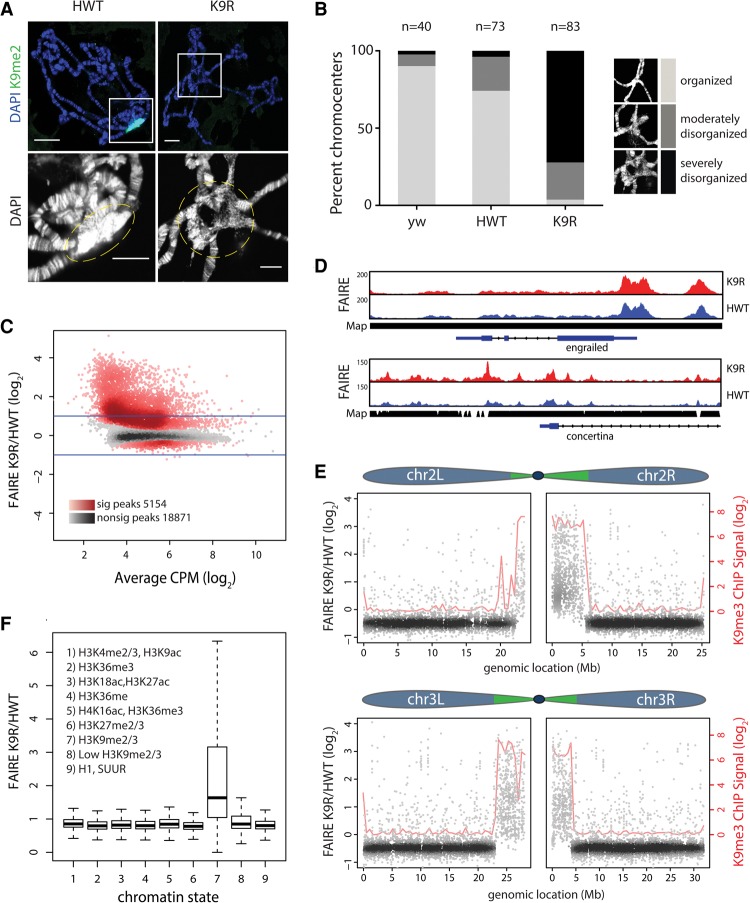
Figure 2.
H3K9 regulates chromatin organization at pericentromeric heterochromatin. (A) HWT and K9R salivary gland polytene chromosomes stained with DAPI and H3K9me2. Bar, 20 µm. The bottom images show a magnified view (white squares) of the chromocenter (dashed lines). Bar, 10 µm. (B) Quantification of chromocenter organization from yw (contains endogenous histones), HWT, and K9R. (C) K9R/HWT ratio of normalized FAIRE (formaldehyde-assisted isolation of regulatory elements) signal from third instar imaginal wing discs at FAIRE peaks called by MACS2 (see also Supplemental Fig. 2). (CPM) Counts per million. The X-axis indicates the average HWT and K9R signal at each peak. Darker colors in the heat map indicate a higher number of peaks. Red peaks are statistically significant as determined by edgeR. P < 0.01. Lines indicate a twofold change. (D) Genome browser shot of FAIRE peaks near the euchromatic gene engrailed and the heterochromatic gene concertina. (Map) Read mappability. (E) K9R/HWT ratio of normalized FAIRE signal plotted versus genome coordinates of FAIRE peaks on chromosomes 2 and 3. Green regions in the chromosome schematic indicate approximate locations of pericentromeric heterochromatin (Riddle et al. 2011; Hoskins et al. 2015). Blue indicates largely euchromatic regions. Loess regression line of modENCODE K9me3 chromatin immunoprecipitation (ChIP) signal is shown in red. (F) Box plot of average ratio of FAIRE signal for FAIRE peaks assigned to one of nine chromatin states (Kharchenko et al. 2010). See also Supplemental Figure 3, C and D.

