Figure 3.
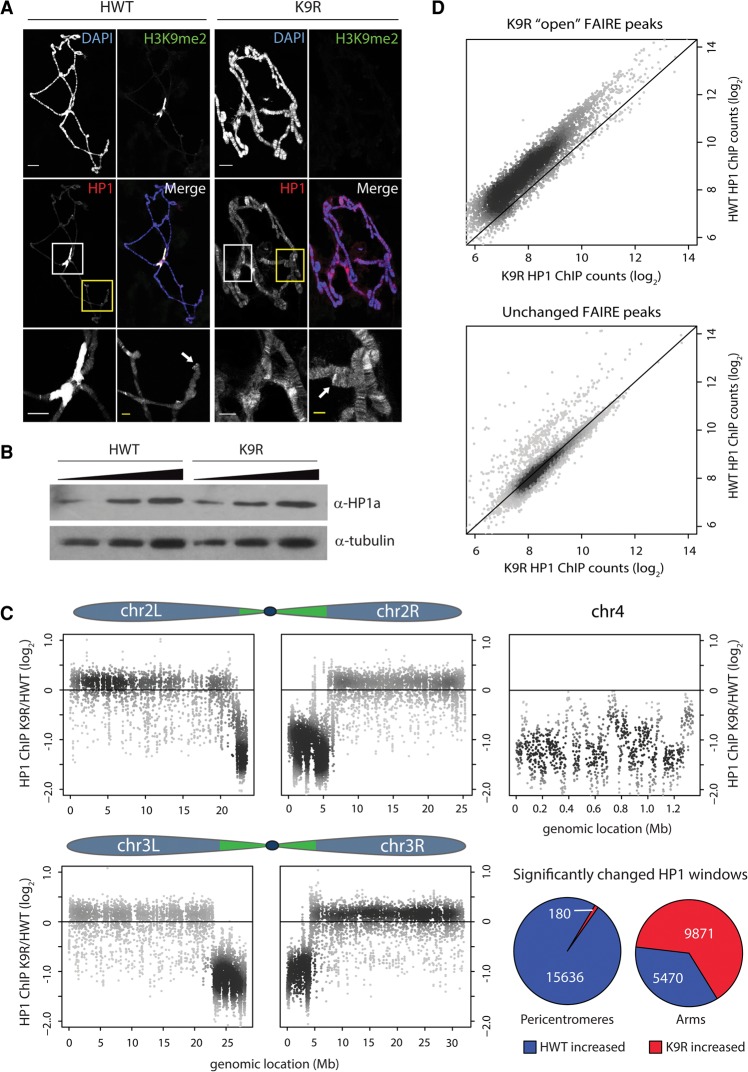
HP1a relocalizes from pericentromeres to chromosome arms in the absence of H3K9. (A) HWT and K9R salivary gland polytene chromosomes stained with anti-H3K9me2 and anti-HP1a antibodies. Bar, 20 µm. The bottom panels show a magnified view of the chromocenter (white box) and a chromosome arm (yellow box) for each genotype. Arrows indicate telomeres. Bar, 5 µm. (B) α-HP1a Western blot of 3, 6, and 12 µg of whole-cell extract from HWT and K9R salivary glands. (C) K9R/HWT ratio of HP1a ChIP-seq (ChIP combined with high-throughput sequencing) signal from whole third instar larvae within 1-kb windows tiled across the five autosome arms. The top 20% of 1-kb windows with the highest counts are shown (see Supplemental Fig. 4 for all windows). Pie charts show the percentage of significantly altered windows on pericentromeres or chromosome arms as called by edgeR. P < 0.01. (D) Scatter plot of HP1a signal at FAIRE peaks with higher signal in K9R samples (top) or a random selection of FAIRE peaks that are not significantly different between HWT and K9R (bottom).

