Figure 4.
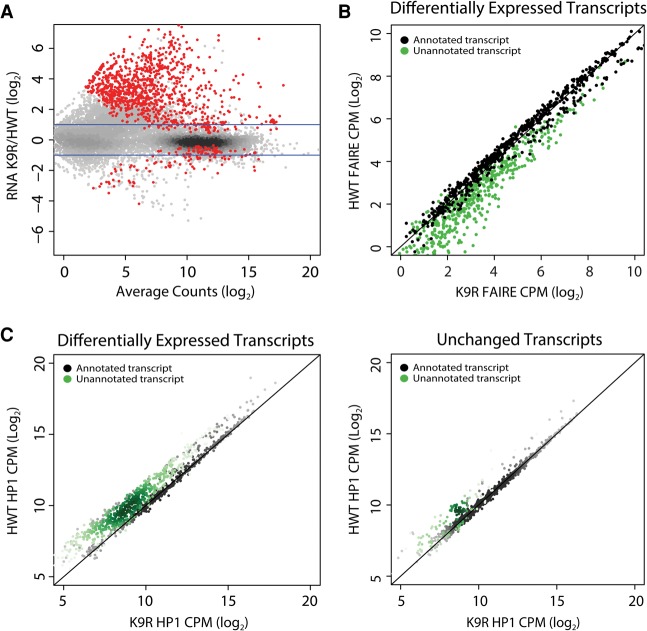
Differential expression of transcripts between HWT and K9R correlates with changes in FAIRE signal and HP1a localization. (A) K9R/HWT ratio of RNA-seq signal from third instar imaginal wing discs. Statistically different ratios identified using DESeq2 are indicated in red. P < 0.05. Blue lines indicate a twofold change. (B) Normalized FAIRE signal at all transcripts differentially expressed between HWT and K9R (red dots in A). Signal is expressed as counts per million (CPM). Black dots indicate transcripts annotated in the RefSeq reference transcriptome. Green dots here and in C indicate transcripts identified in Cufflinks transcriptome assembly but not in the reference transcriptome. (C) Scatter plot of normalized HP1a ChIP signal within transcripts differentially expressed between K9R and HWT (left) or a random selection of transcripts that are not significantly different between the two genotypes (right).

