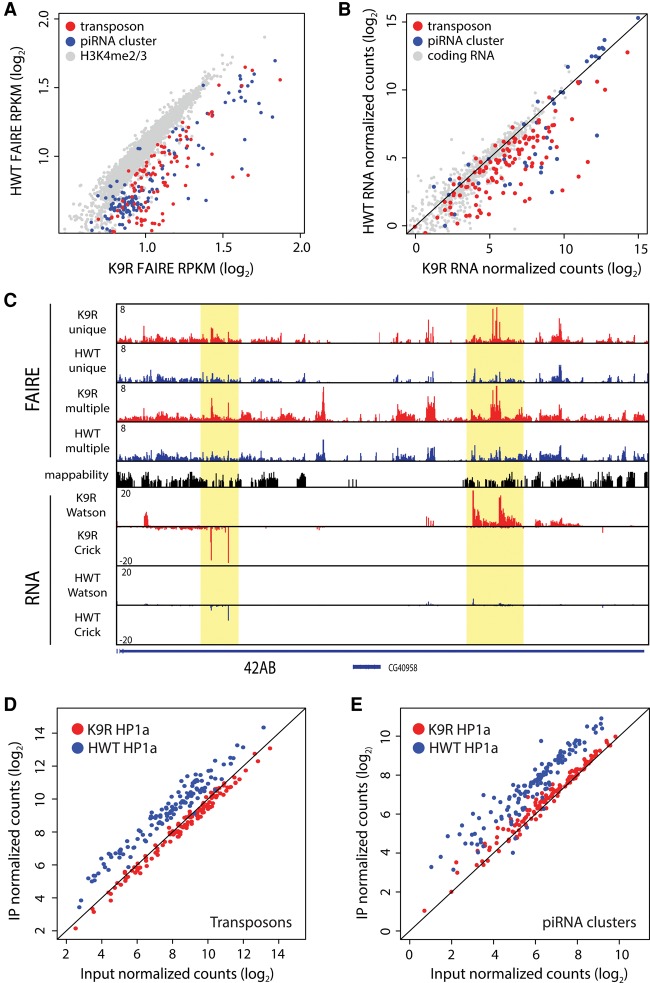
Figure 5.
H3K9 represses transposon and piRNA cluster expression. (A) Scatter plot of FAIRE-seq signal ([RPKM] reads per kilobase per million) at individual transposon families (red) or piRNA clusters (blue). H3K4me2/me3-enriched promoter regions (grey) are shown for comparison. (B) Scatter plot of RNA-seq signal at transposons (red) and piRNA clusters (blue). A random selection of protein-coding RNAs was selected for comparison (gray). (C) Genome browser shot of FAIRE and RNA signal at the 42AB piRNA cluster. FAIRE signal is shown for both uniquely and multiple mapping reads. RNA signal contains uniquely mapping reads only. Highlighted areas indicate regions of increased FAIRE and RNA signal in K9R samples. (D,E) Scatter plot of HP1a ChIP-seq signal at transposon families (D) or piRNA clusters (E) comparing input and immunoprecipitated (IP) samples.

