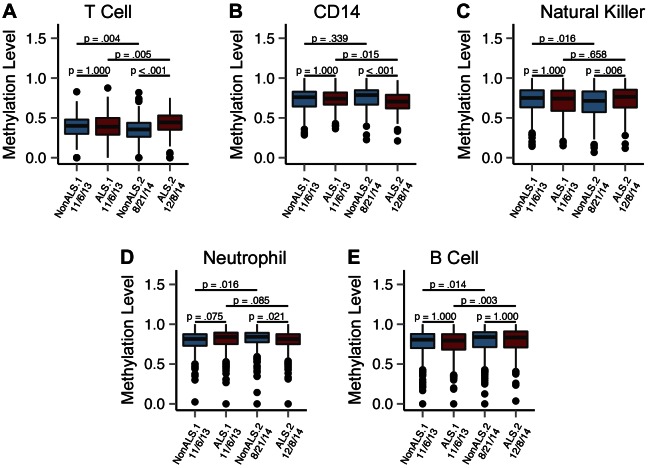
Figure 1.
Methylation distribution at cell-type–specific CpG sites in the PBMC samples from ALS-discordant twins. Methylation-level box plots for the PBMC samples obtained in 2013 (box 1: November 6, 2013; box 2: November 6, 2013) and 2014 (box 3: August 21, 2014; box 4: December 8, 2014) at T-cell–specific (A), CD14-specific (B), NK+-specific (C), neutrophil-specific (D), and B-cell–specific (E) CpG sites. Blue: healthy twin; red: ALS-affected twin. The inner band of the box plot marks the median methylation value of the of the sample, with the lower and upper bounds of the box marking the first and third quartiles. The Bonferroni-adjusted P values were calculated to test for differences in the methylation level distribution between samples; the Mann-Whitney U test was used to analyze the differences between the twins in the 2013 and 2014 samples and in the batches from the unaffected and affected twins.

