
Figure 3.
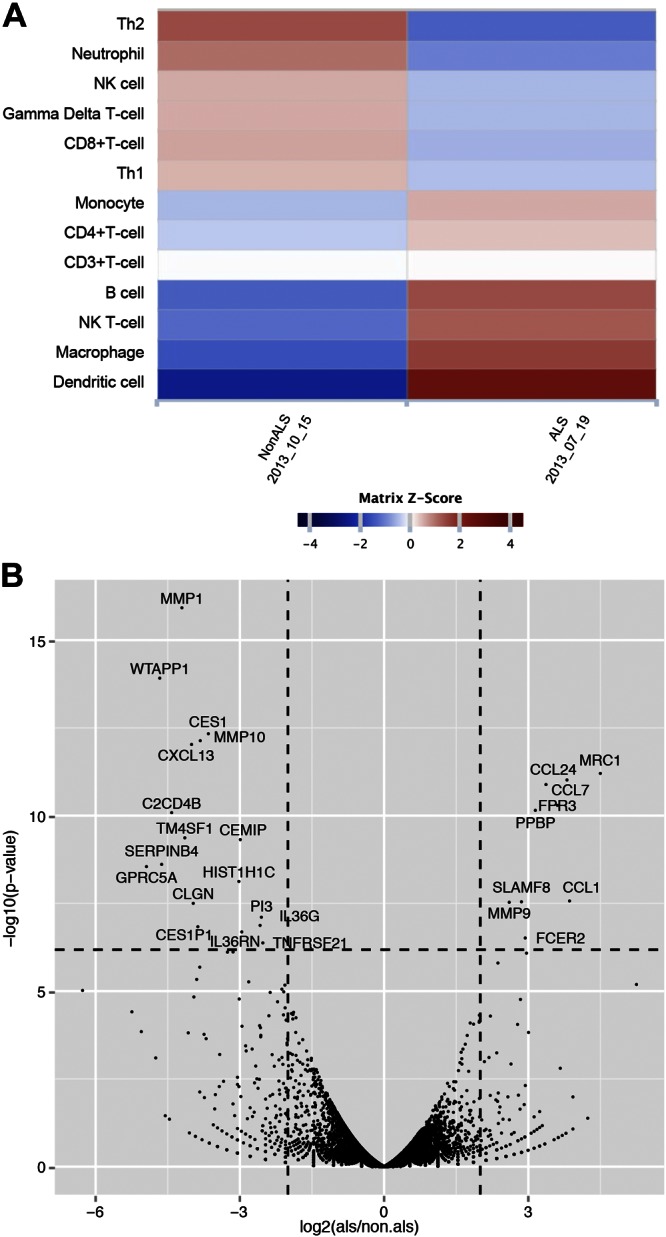
Differences in expression signatures between the twins. A) Heat map of the z scores for the signature Δ expression levels. Left column: signature Δ z score for the non-ALS PBMC sampled on October 15, 2013; right column: signature Δ z score for the ALS PBMCs sampled on July 19, 2013. Red: higher signature expression level vs. the mean Δ. Blue: lower signature expression level vs. the mean Δ. Among the 13 expression signatures, the dendritic cell signature z score reveals a significant difference from the matrix mean. B) A volcano plot of the 15,152 normalized gene count. Differences between the twins in gene expression are shown as log2 on the horizontal axis. The significance of differentially expressed genes is shown on the vertical axis, with a minimum Bonferroni corrected −log10, P = 6.18.