Figure 1.
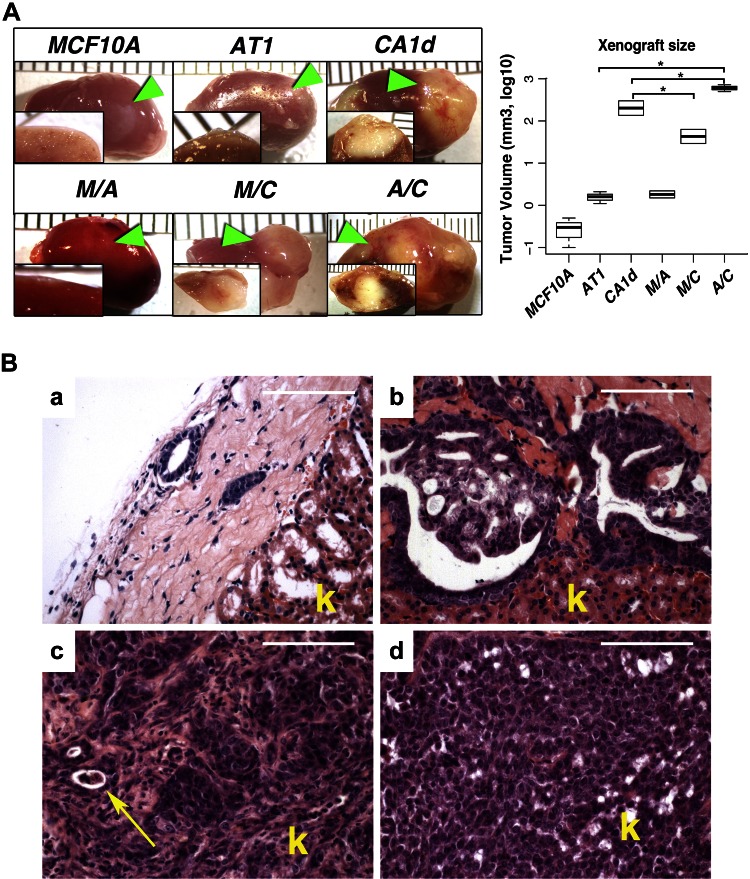
In vivo growth of MCF10A, AT1, and CA1d breast cell lines. A) MCF10A and AT1 grafts demonstrated minimal growth, grossly appearing small and white, while CA1d grafts were significantly larger (>700-fold larger than MCF10A and >100-fold than AT1) with signs of invasion. Mixed tumors were very aggressive, destroying >50% of renal parenchyma. Arrowheads show position of tumors in kidney. Graph depicts tumor volume (mean ± sd) on log10 scale. *P < 0.05, 1-way ANOVA with Dunnett’s multiple comparison test. B) a) Histologically, MCF10A cells formed limited numbers of round glandular benign structures with small lumens and without any sign of malignancy. b) Premalignant AT1 cell line produced lesions consisting of simple ducts with some areas of benign hyperplasia and others resembling carcinoma-in-situ without any evident invasion into kidney. c) CA1d grafts were composed of invasive adenocarcinomas with large areas of undifferentiated cells. Arrow indicates glomerulus remnant surrounded by cancer cells. d) Mixed AT1/CA1d tumors showed more solid pattern compared to CA1d tumors. These tumors, although less obviously invasive at histologic level, were highly aggressive. Scale bars, 200 μm. k, kidney.

