Figure 2.
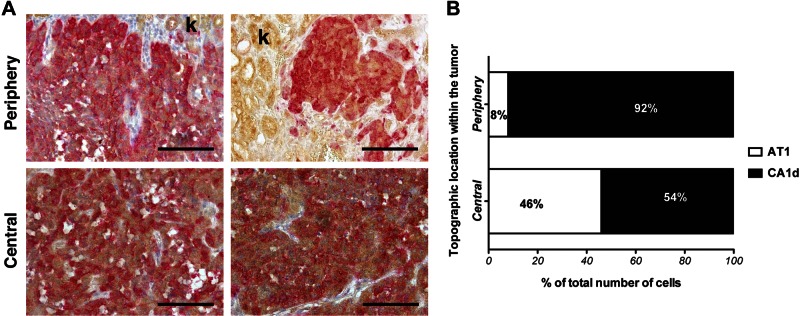
Topographical localization of AT1 and CA1d cells in mixed tumors. A) Localization of AT1 and CA1d in mixed tumors revealed distinct pattern of distribution. Double immunohistochemical staining was performed of GFP-labeled AT1 (dark brown) and RFP-labeled CA1d cells (red) in 2 different tumors. Invasive front was composed mainly of CA1d cells and fewer AT1 cells. Kidney parenchyma shows light brown nonspecific background staining (k). B) While both cell types occupied center of tumor in similar ratio, CA1d cells dominated margins of tumor. Scale bars, 200 μm. k, kidney.

