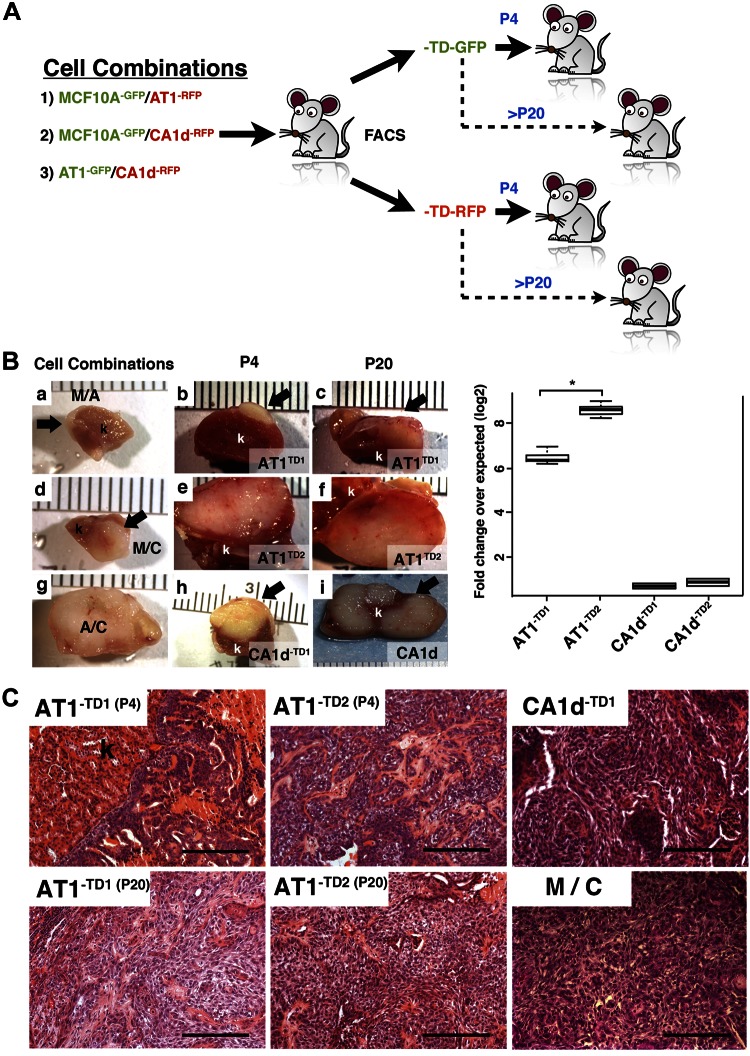
Figure 3.
Characterization of TD AT1 and CA1d cells. A) Isolation of TD cells. Cells were combined in 1:1 ratio and grafted in female SCID mice. Cells were allowed to grow in vivo for 80 d and reisolated by FACS. Sorted cells were expanded separately and then regrafted alone at passage 4 and passage 20. B) Quantitation of tumor volume. Left: gross appearance of renal xenograft. Compared to MCF10A/AT1 (a) or MCF10A/CA1d (d), AT1/CA1d (g) tumors (arrows) increased in size. Reisolated AT1 cells from mixed A/C formed larger tumors compared to parental cells. At both passage 4 (P4) and passage 20 (P20), AT1-TD2 (e, f) cells formed larger tumors than AT1-TD1 (b, c). Cells grafted after 20 passages revealed that early changes (P4) were permanent. CA1d-TD1, and CA1d-TD2 (h) grew slightly better than parental CA1d (i). Right: AT1-derivative tumors (AT1-TD1 and AT1-TD2) were significantly larger compared to parental AT1 cell. AT1-TD2 clone tumor size was significantly bigger than AT1-TD1. Tumors derived from tumorigenic CA1d cells (CA1d-TD1 and CA1d-TD2) were slightly larger than tumors from their expected control line. k, kidney. Graph depicts tumor volume (means ± sd) on log2 scale. *P < 0.05, 1-way ANOVA with Dunnett’s multiple comparison test. C) Histologic analysis of grafts. Tumors were composed of highly invasive cancer cells with strong stromal reaction, consistent with malignant phenotype of these tumors. AT1-TD1 and AT1-TD2 grafted at P4 showed cancer cells with invasive phenotype. However, both AT1-TD cell lines at P20 were more aggressive and had mesenchymal type similar to CA1d-TD1 and CA1d-TD2 cells. Scale bars, 200 μm.

