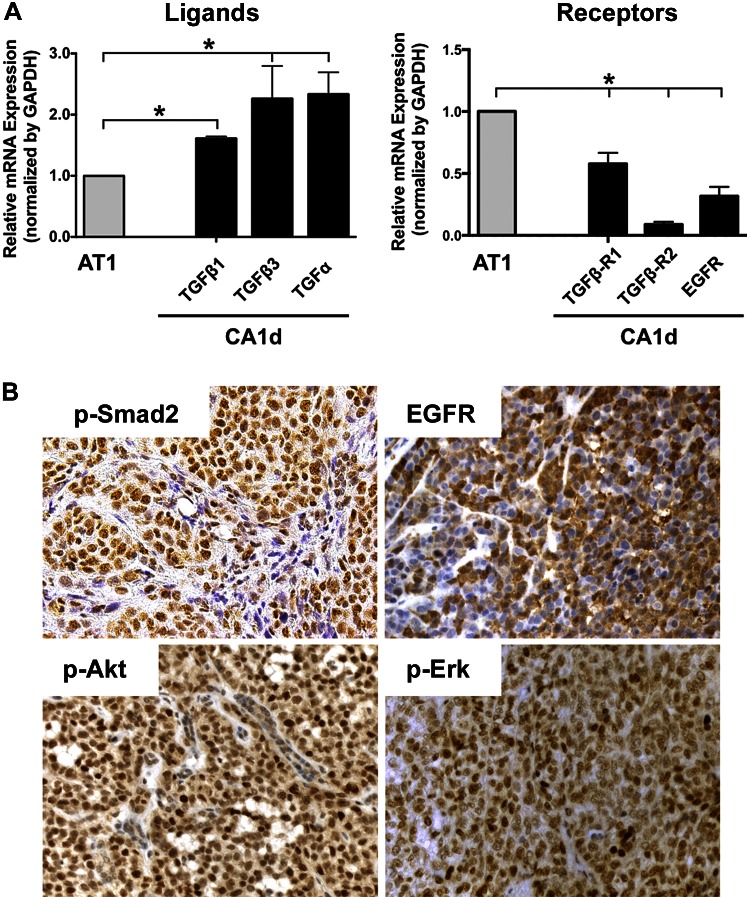
Figure 4.
Expression of TGF-α and TGF-β ligands and their receptors in parental and tumor-derived cell lines. A) TGF-α and TGF-β family members and their corresponding receptor mRNA levels were quantitated in AT1 and CA1d cells. Data were normalized to GAPDH, and expression of target genes was compared to AT1 levels. Left: CA1d cells expressed higher levels of ligands compared to AT1 cells. Right: expression of corresponding receptors was significantly increased in AT1 cells, suggesting that these cells have ability to respond to presence of paracrine-secreted factors. *P < 0.05, 1-way ANOVA with Dunnett’s multiple comparison test. B) Immunohistochemical staining of mixed A/C tumors. To corroborate presence of TGF-β and EGFR activation in our in vivo tumors, immunohistochemistry of P-Smad2, EGFR, p-Erk, and P-Akt was performed. While pSmad2 and EGFR showed relatively uniform staining, pattern of P-Akt and p-Erk depicted high-expressing intermingled with low-expressing cells.

