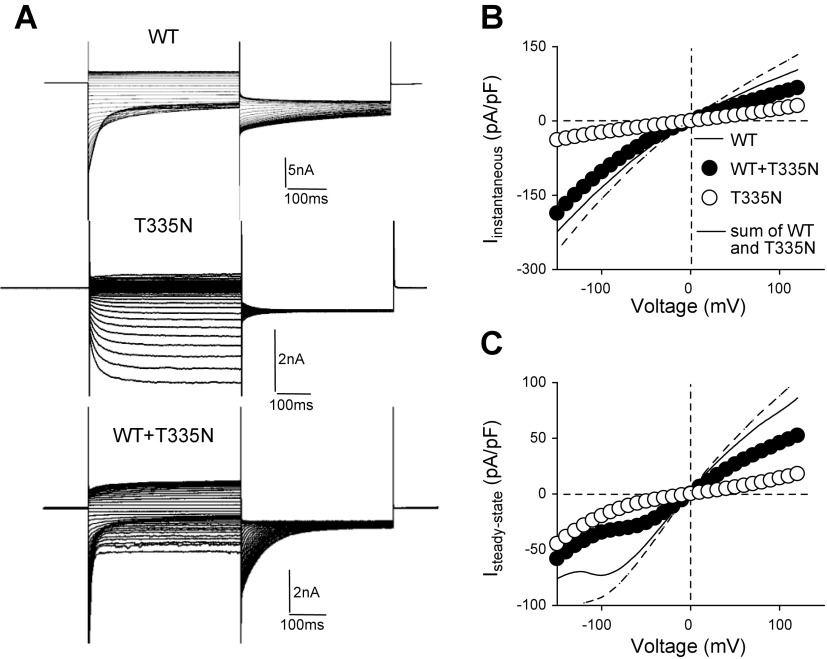
Figure 1.
Current amplitude for hClC-1 WT, T335N, and WT + T335N channels in high intracellular chloride. A) Representative chloride currents recorded from tsA cells transfected with hClC-1 WT (5 μg), T335N (5 μg), or with equal amount of WT and T335N (5 μg + 5 μg) cDNAs in high-chloride intracellular solution. B) Instantaneous currents were normalized with respect to cell capacitance (pA/pF) and reported as a function of voltage. C) Steady-state currents were reported as mean current density as a function of voltage. Solid lines represent WT currents; dashed line represents the algebraic sum of current densities calculated for WT and T335N expressed alone. Each point is mean ± sem from 13–18 cells.

