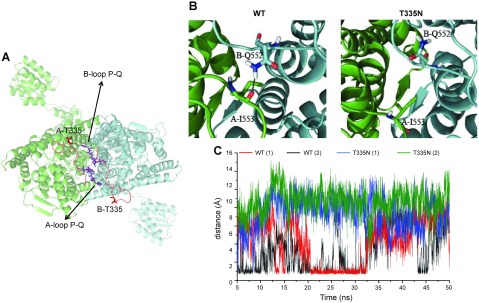
Figure 4.
Visual inspection of the ClC-1 homology model and analysis of H-bond interactions. A) Top view of the homology model. Atoms belonging to residue T335 and to loop P-Q are rendered as sticks, whereas the ClC-1 dimer is shown in cartoon representation. B) Enlarged monomers are depicted in cartoon representation, whereas important residues are shown as sticks. H-bond interaction is depicted by a dotted line. C) Time-dependent evolutions of the distance between the nitrogen donor of the side chain of B-Q552 and the oxygen atom of the A-I553 backbone resulting from 2 independent MD simulations of WT (red and black lines) and T335N (blue and green lines).

