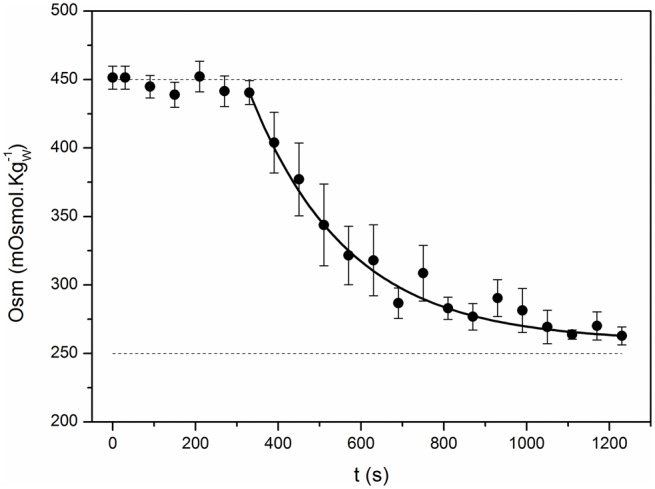
Figure 3.

Time course of the external osmolality. The kinetics of osmolality in the external chamber was registered in control experiments. The iso-osmotic condition (450 mOsmol.) was maintained during 300 s and then, the external solution was replaced for a hypo-osmotic one (260 mOsmol.). Small aliquots (50 μL) were regularly taken from the external chamber to measure osmolality along time. Black symbols represent the mean ± SEM of 7 independent experiments. Continuous line shows the fitting to an exponential function . The fitting parameters are: B = 731.5 ± 94.5 mOsmol.; t* = 237.2 ± 22.4 s; and Ce* = 258.8 ± 3.2 mOsmol.; R2 > 0.98).
