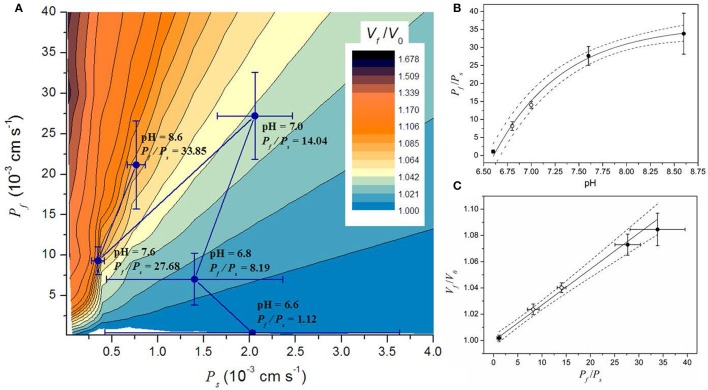
Figure 5.
Simulation results in the context of the parameter space of a model involving water and solutes transport (WS model). A small portion of the parameter space is shown in (A). The parameter space shows all the possible steady volumes (in color code) predicted by the WS model. The Pf and Ps values obtained by fitting simulations are superimposed and shown as mean ± SEM. (B) Relationship between the Pf/Ps ratio and pH. Symbols represent the mean ± SEM of the Pf/Ps ratio. Continuous line shows the fitting to an exponential function . Fitting parameters are: A = −36.5 ± 1.4; = 36.3 ± 1.1; pH* = 6.6; and pH' = 0.73 ± 0.09; R2 > 0.99). (C) Relationship between the steady volume (Vf/V0) and the Pf/Ps ratio. Symbols represent the mean ± SEM of both the Pf/Ps and the Vf/V0 ratios obtained with the WS model. Continuous line shows the result of a linear fitting (intercept: 1.00 ± 0.002, slope: 0.0025 ± 0.0001, R2 > 0.99). Dash lines in (B,C) represent the 95% CI. In both panels, open circles are data from experiments performed in this work (pH 7.0 and 6.8), and black circles are data taken from previous experiments (Amodeo et al., 2002).

