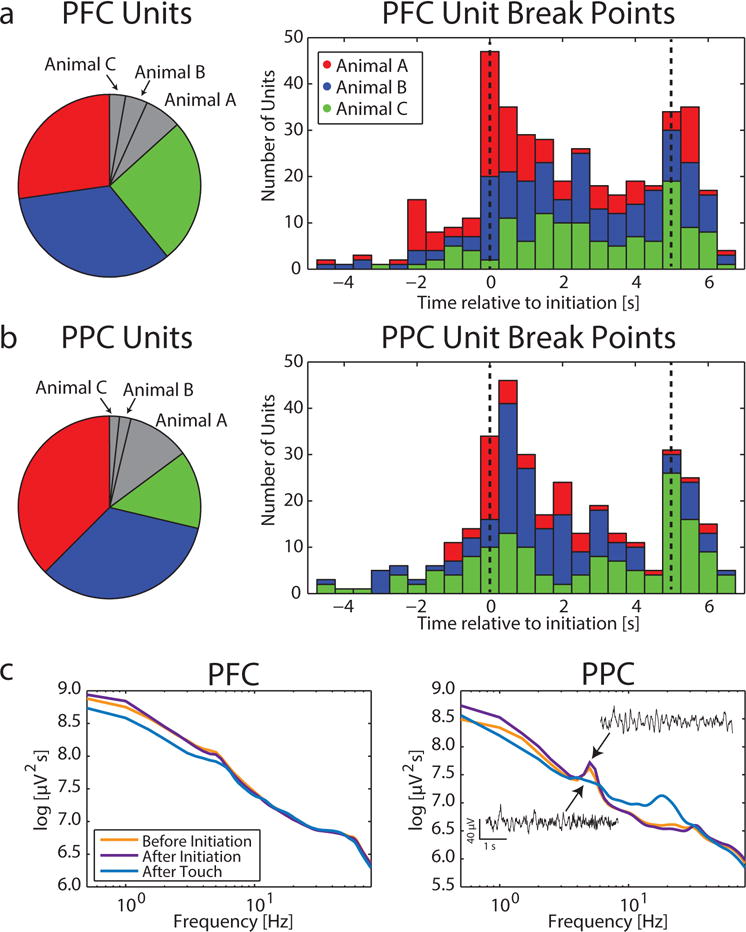
Figure 3. Task-dependent modulation of single unit spiking and spectral activity.

a) Left: 86.7% of PFC units across all animals showed significant modulation during the peristimulus period (−5 to 7 s relative to trial initiation). Colored pie pieces indicate significantly modulated units for each animal, while gray pieces show units with non-significant modulation. Right: Distribution of the largest breakpoint for each significantly modulated PFC unit; structural change in spiking activity was most prominent during the sustained attention period. Dashed lines indicate trial initiation and stimulus onset times.
b) Left: 85.1% of PPC units across all animals exhibited significant modulation during the peristimulus period. Colors as in (a). Right: In PPC, distribution of the largest breakpoint for each significantly modulated unit; structural change in spiking activity was most prominent immediately following trial initiation and at stimulus onset.
c) Spectra shows average power before initiation (−5 to 0 s relative to initiation), after initiation (0 to 5 s relative to initiation), and after touch (0 to 5 s relative to touch). Left: PFC exhibited 1/f structure with little spectral modulation. Right: In PPC, a prominent 5Hz peak was evident before and after trial initiation, but not following touch. Insets show example LFP activity filtered in the theta frequency band.
