
Figure 4. Effective connectivity and task-dependent synchronization between PFC and PPC at 5Hz.
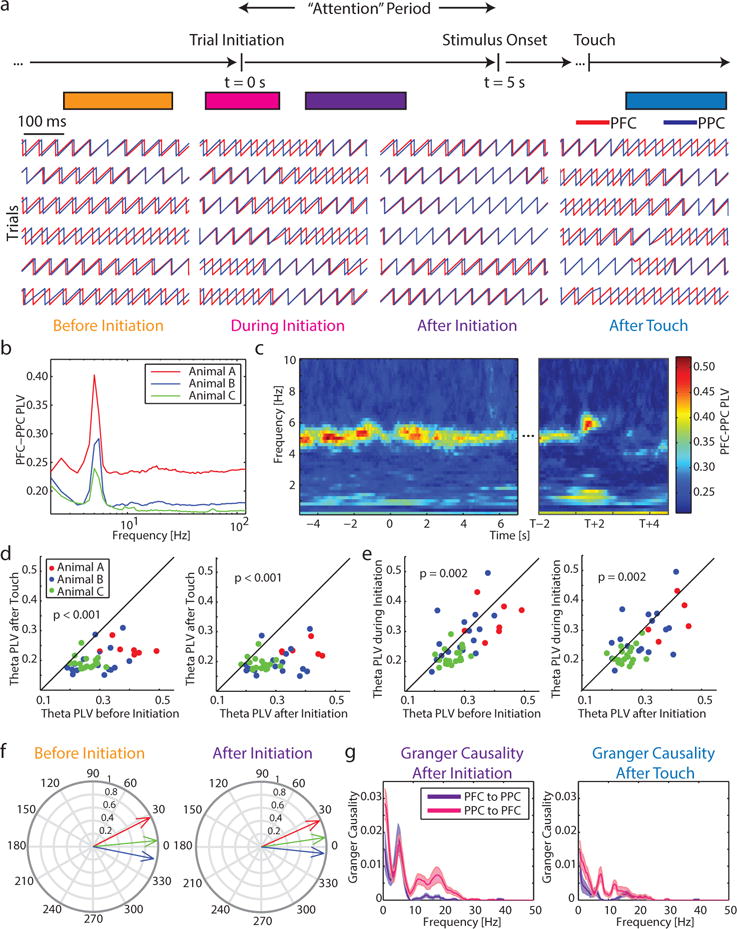
a) LFP-LFP phase locking was used to assess synchronization between PFC and PPC. At behaviorally-relevant periods during the behavior task (before initiation = −3 to −1 s relative to initiation, during initiation = −0.5 s to 0.5 relative to initiation, after initiation = 1 to 3 s relative to initiation, after touch = 1 to 3 s relative to touch) phases in PFC and PPC were assessed for consistent differences. Here, the phase at 5Hz is shown for one pair of channels across trials.
b) PLV was highest at 5Hz.
c) Averaged for Animal A, phase locking between PFC and PPC was prominent before and after trial initiation, weakened during trial initiation and by stimulus onset, and effectively abolished following touch. See Figure S4 for other animals.
d) Phase locking values before initiation (left) and after initiation (right) were significantly greater than after touch (p-values for paired t-test). Each dot represents one recording session.
e) Phase locking values before initiation (left) and after initiation (right) were significantly greater than during initiation (p-values for paired t-test).
f) The phase difference between PFC and PPC was near zero for all animals, both before initiation and after initiation. Plot shows proportion of recordings vs phase differences in degrees.
g) Pairwise spectral Granger causality was calculated on the median LFP in each brain area during the sustained attention period (left) and after touch (right). Bi-directional effective connectivity in the theta range and bottom-up effective connectivity in the beta frequency range were evident during the attention period. Both of these forms of communication are decreased in the period after touch. Lines represent mean across recordings, shaded areas represent ± 1 SEM.