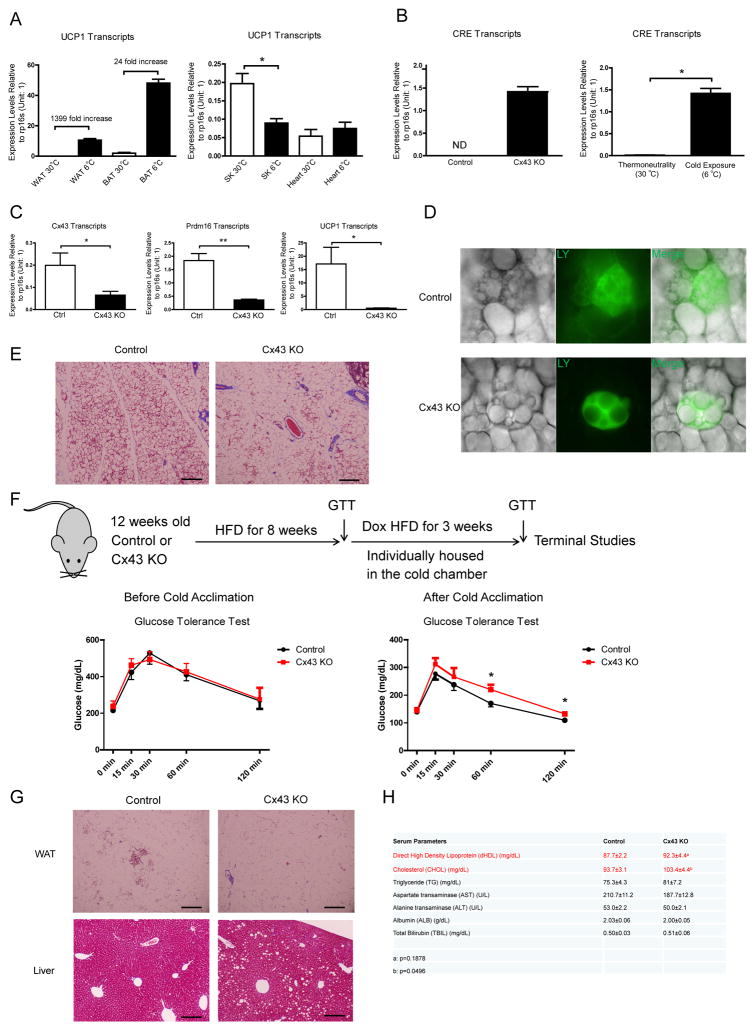
Figure 3. UCP1 Promoter-Driven Cx43 Deletion Blunts Cold Induced Metabolic Improvements.
A. UCP1 transcripts in various metabolic tissues after 48-hour cold exposure (n = 4). WAT: white adipose tissue; BAT: brown adipose tissue, SK: skeletal muscle. B. CRE expression in WAT after 48-hour cold exposure (n = 2–3). C. Cx43, Prdm16, UCP1 expression levels in WAT after 48-hour cold exposure (n = 4). D. Lucifer Yellow coupling experiments in control and Cx43-KO beige adipocytes. E. Trichrome staining of control and Cx43-KO WAT after a 3-day cold exposure. F. Schematic of mouse treatment regimen, GTTs before (n = 4–7) and after (n = 6–7) cold exposure. G. Trichrome staining of WAT and Liver from mice referred in Panel F. H. Serum lipid profiles and liver enzymes from the mice referred in Panel F (n = 6–7). Scale bar = 100 μm. Results are shown as mean ± SEM, *p<0.05, **p < 0.01.

