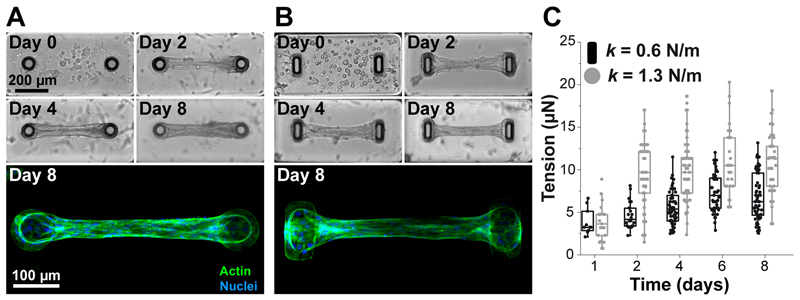
Figure 4. Temporal evolution of microtissues composed of NIH 3T3 fibroblasts in collagen gels.
Representative images and immunostainings (actin in green, nuclei in blue) depicting the time course of a contracting microtissue tethered to circular (A) and rectangular (B) cantilevers. (C) Temporal evolution of the tension generated by microtissues tethered to rectangular (k = 0.6 N/m, in black) and circular (k = 1.3 N/m, in gray) cantilevers.

