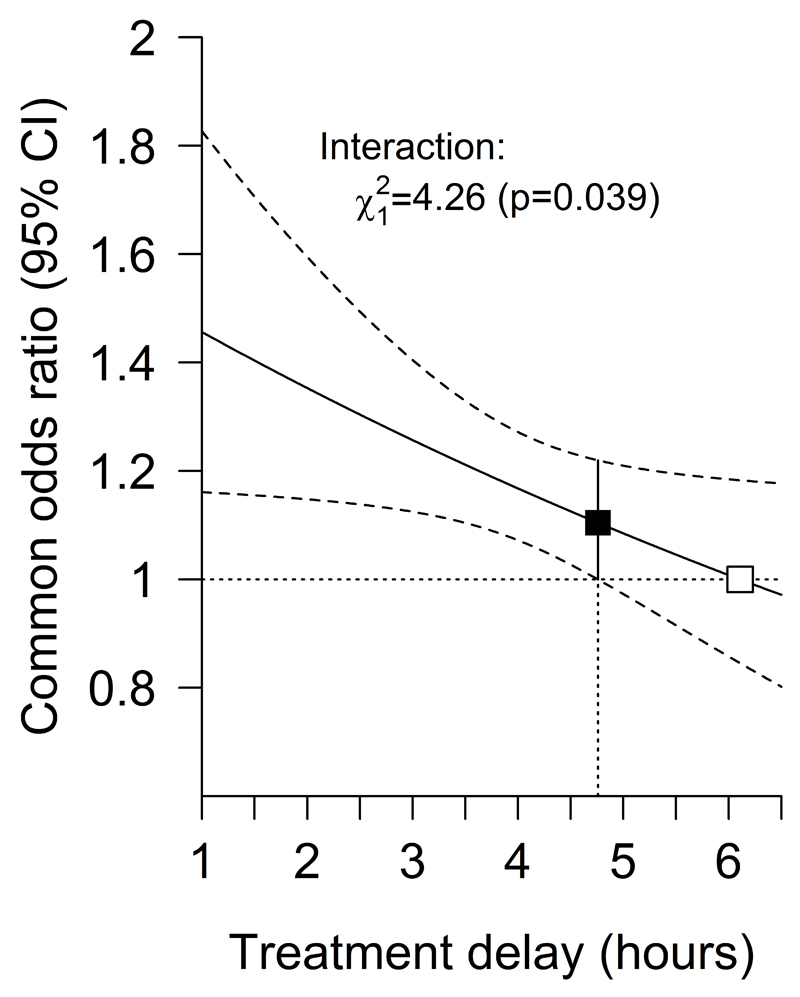
Figure 3. Effect of alteplase on any upwards shift in mRS, by treatment delay.
The solid line represents the best linear fit between the log odds ratio for an improved stroke outcome among patients given alteplase compared with patients given control (vertical axis) and treatment delay (horizontal axis). Estimates are derived from a regression model in which alteplase, time to treatment, age and stroke severity (handled in a quadratic manner) are included as main effects but the only treatment interaction included is with time to treatment. Only 198 patients (159 of whom were from IST−3) had a time from stroke onset to treatment of more than 6 hours. The point at which the estimated treatment effect crosses 1 is therefore an extrapolation from the data.

