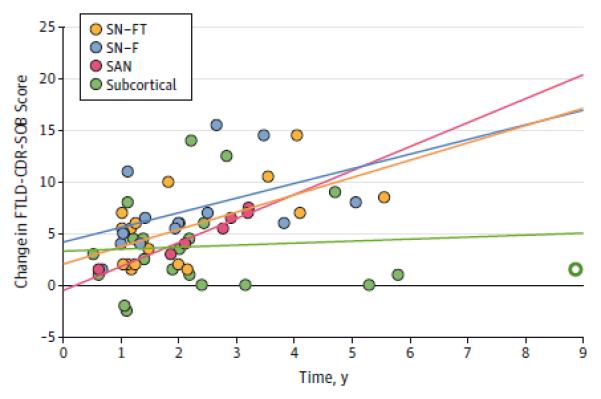
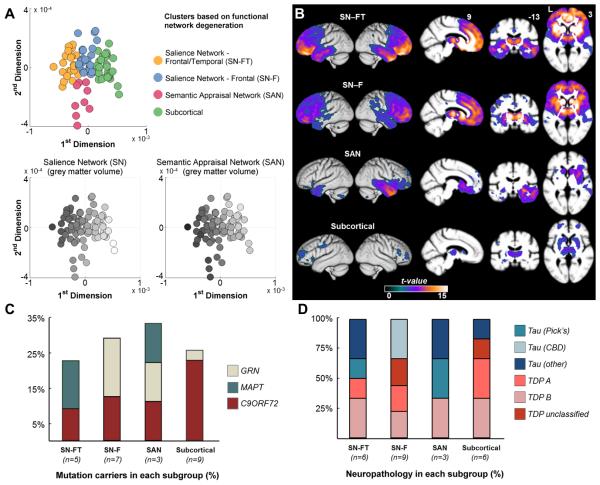
Figure 2. Anatomic subtypes of bvFTD.

bvFTD patients are clustered into four distinct subgroups based on the degree of atrophy in 18 ROIs defining SN and SAN functional networks. The four clusters consist of two distinct SN affected groups – frontotemporal (SN-FT, the yellow dots) and frontal (SN-F, the blue dots), one SAN affected group (the pink dots), and one subcortical group (green dots). A (top panel): Each patient is colored according to their cluster assignment and plotted onto the first two dimensions of a principal component analysis based on the same 18 ROIs. A (bottom panels): The grey scale indicates the normalized volume of the sum of each patient’s ROIs representing the SN and SAN networks respectively, where darker colors show greater degree of volume loss. x and y axes are the same as for the top panel. B: Voxel based morphometry-derived atrophy maps of each bvFTD subgroup. T maps show the atrophy patterns compared to age matched normal controls (n = 44), and are superimposed onto whole-brain template derived from elderly normal controls. Effects are corrected for age, gender and total intracranial volume of each individual, and are corrected for family-wise error at the whole brain level at P<.05. C: Percentage of mutation carriers for C9ORF72, MAPT, or GRN mutations in each subgroup. D: Percentage of patients found to have specific classes of neuropathology associated with each bvFTD subgroup, among the subset of patients with autopsy diagnosis. Patients who were diagnosed as Tau-other pathology included two SN-FT patients with FTLD-tau with MAPT mutation, one SAN patient with FTDP17, and one subcortical patient with argyrophilic grain disease. CBD = corticobasal degeneration; C9ORF72 = chromosome 9 open reading frame 72 hexanucleotide expansions; FTDP-17=Frontotemporal dementia with parkinsonism-17; FTLD=Frontotemporal lobar degeneration; GRN = progranulin; MAPT microtubule-associated protein tau; ROI = region of interest; SAN = sematic appraisal network; SN = salience network; TDP = transactive response DNA-binding protein 43.

