
Fig. 4.
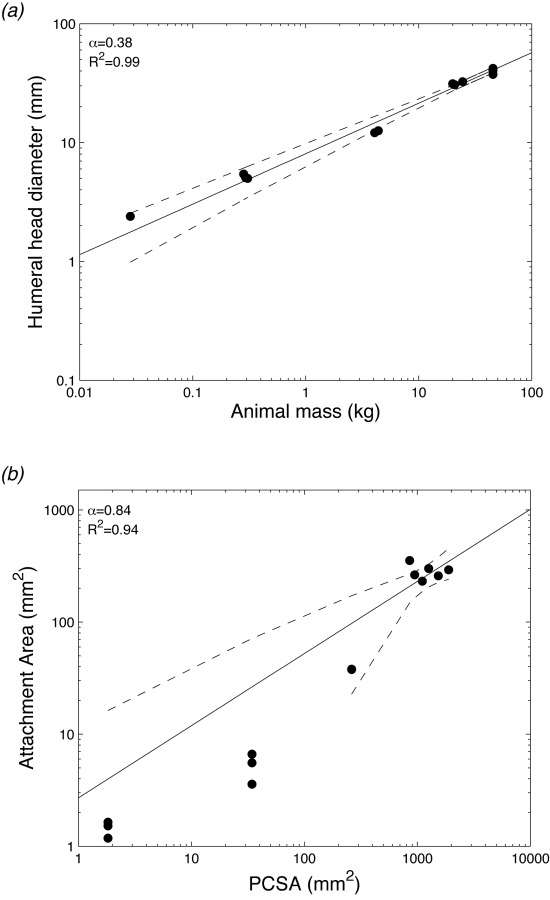
Millimeter-scale features: (a) plot of humeral head diameter as a function of animal mass. The scaling factor was 0.38, indicating a near isometric relationship. Isometry of α = 0.33 is shown as a dotted line. (b) Plot of insertion area as a function of PCSA. The scaling factor was 0.84, indicating near isometric behavior. Isometry of α = 1 is shown as a dotted line. Ninety-five percent of confidence intervals are shown as dashed lines.