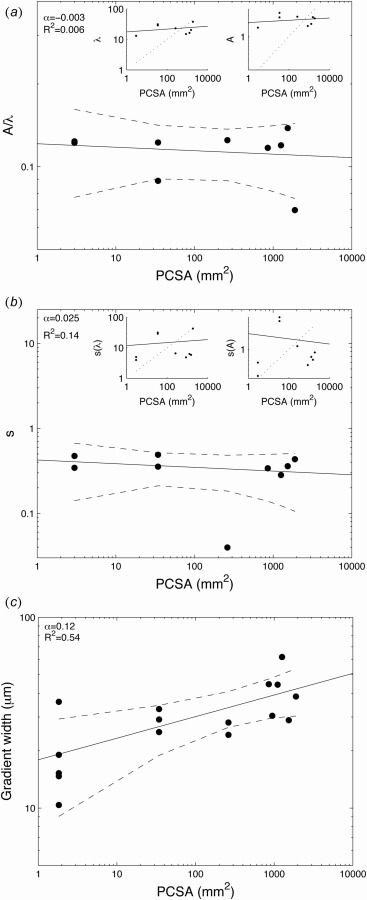
Fig. 5.

Micrometer-scale features: (a) plot of A/λ as a function of PCSA. The insets show A and λ independently as a function of PCSA. Isometry of α = 0.5 is shown as dotted lines in the inset. The small scaling factors for A, λ, and A/λ indicate hypoallometry of the roughness. (b) Plot of the standard deviation of A/λ as a function of PCSA. The insets show standard deviations of A and λ independently as a function of PCSA. Isometry of α = 0.5 is shown as dotted lined in the inset. The small scaling factors of the standard deviation of A, λ, and A/λ indicate a hypoallometric relationship. (c) Plot of width of the mineralization gradient as a function of PCSA. The scaling factor was 0.12, indicating a hypoallometric relationship compared to the isometry (dotted line) of α = 0.5. Ninety-five percent of confidence intervals are shown as dashed lines.
