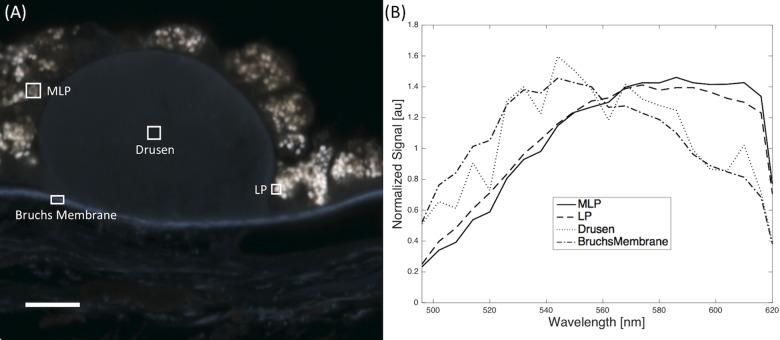
Fig 4. Spectral analysis of retina section.
(A) An example of the ROIs selected is shown in an image with melanolipofuscin (MLP), lipofuscin (LP), Drusen, and Bruch’s Membrane. Scale bar in lower left indicates 10 microns. (B) The averaged spectra of each selection normalized by its spectral average.

