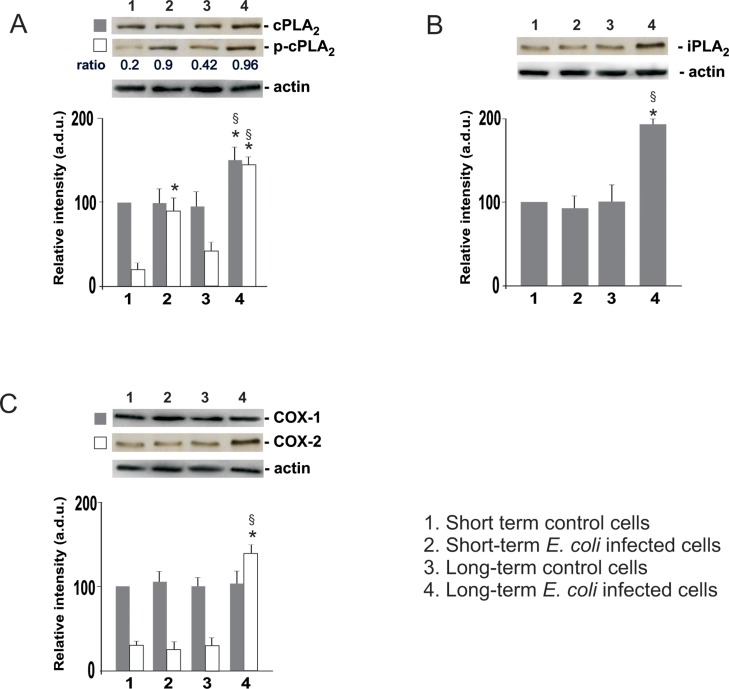
Fig 5.
Western blot analysis of cPLA2 and p-cPLA2 (A), iPLA2 (B), and COX-1/2 (C) in INS-1E cells after short and long-term infection with E. coli. The values, expressed as arbitrary densitometric units (a.d.u.) were obtained by reading the blots using the ImageJ program and are the mean ± SD from three independent experiments (n = 3) performed in triplicate. Control cells: non infected cells. Statistically significant differences, determined by one-way ANOVA and the Tukey post test, are indicated (p< 0.05). (*) infected vs non-infected cells at the same incubation period; (§) long-term infected vs short-term infected cells (line 4 vs line 2).

