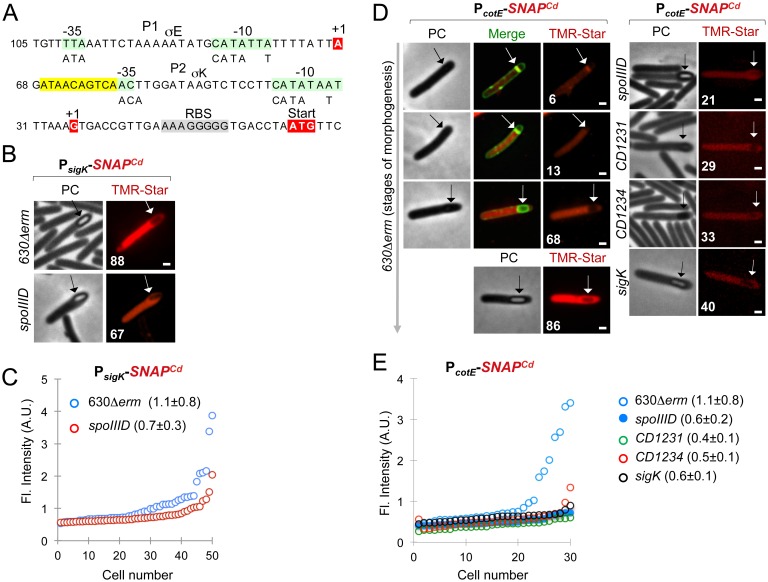
Fig 3. Control of sigK expression and of σK activity.
A: promoter region of the sigK gene. The transcriptional start sites (+1, red) as previously mapped [34], the -10 and -35 promoter elements (green) that match the consensus for σE or σK recognition (represented below the sequence), the SpoIIID box (yellow), and the start codon of the sigK gene, are indicated. B: microscopy analysis of C. difficile cells carrying a PsigK-SNAPCd fusion in strain 630Δerm and in the spoIIID mutant. The cells collected after 24 h of growth in SM were stained with TMR-Star and examined by phase contrast (PC) and fluorescence microscopy. The morphological stage at which sigK transcription reaches its maximum, concomitant with the appearance with phase gray spores, is illustrated. The position of the forespore is clearly seen in the PC images. The numbers represent the percentage of cells at the indicated stage that show expression of the reporter fusion. C: quantitative analysis of the fluorescence intensity (Fl., in arbitrary units, A.U.) in sporulating cells (as in B) expressing PsigK- SNAPCd. The numbers in the legend represent the average fluorescence intensity ± SD (a minimum of 50 cells were scored). D: microscopy analysis of cells carrying fusions of the σK-dependent cotE promoter to SNAPCd in strain 630Δerm and in the spoIIID, CD1231, CD1234 and sigK mutants. Cells were collected and processed for imaging as indicated in panel B. However, MTG staining was used to visualize the forespore membranes and the stage of sporulation during engulfment; the merged images show the overlap between TMR-star (red) and MTG (green). Note that merged images (MTG/TMR-Star) are not shown whenever the position of the forespore is seen in the PC images. The panels are representative of the expression patterns observed for different sporulation stages, ordered from early to late. For the mutant strains, the morphological stage characteristic of each mutant is shown. The numbers refer to the percentage of cells at the represented stage showing SNAPCd fluorescence. E: quantitative analysis of the fluorescence (Fl.) intensity in the various strains expressing PcotE-SNAPCd. The numbers in the panels are the average fluorescence intensity ± SD (30 cells were analyzed). In B and D, the arrows show the position of developing spores. Scale bar, 1 μm.

