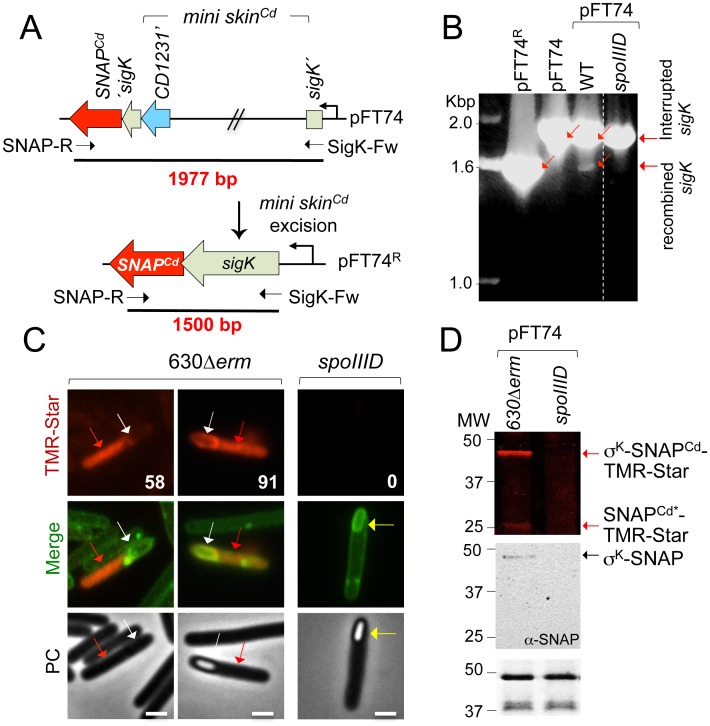
Fig 4. Time of excision of a mini-skinCd element as detected by production of a σK-SNAPCd fusion protein.
A: schematic representation of plasmid pFT74, containing the SNAPCd reporter fused in frame to the 3´-end of sigK. The sigK gene is interrupted by a mini-skinCd element carrying the 3´end of the CD1231 gene (blue). When skinCd excision occurs to form pFT47R, σK-SNAPCd is produced. The size of the inserts before and after recombination is indicated. The primers used for PCR analysis are indicated. B: analysis of skinCd excision by PCR using the primer pair indicated in panel A and DNA extracted from cultures of the strain 630Δerm, and the spoIIID mutant after 24 h of growth in SM. The red arrows point to the recombined sigK and the interrupted gene. pFT74 and pFT74R were used as controls for non-recombined and recombined sigK, respectively. C: fluorescence microscopy analysis of sporulating cells producing σK-SNAPCd in the strain 630Δerm and in the spoIIID mutant. Cells grown in SM were collected at 24 h and stained with the membrane dye MTG and TMR-Star. The red arrows point to the mother cell, and the white arrow to the developing spore. The yellow arrow shows the position of a spore in a spoIIID sporangium. The numbers refer to the percentage of cells at the represented stage showing production of the fusion. Scale bar, 1 μm. D: accumulation of σK-SNAPCd in extracts produced from sporulating cells of the WT and spoIIID mutant. The cells were collected from SM cultures 24 h after inoculation, labeled with the TMR-Star substrate. Proteins in whole cell lysates were resolved by SDS-PAGE, visualized by fluoroimaging or subject to immunoblot analysis with anti-SNAP antibodies. A section of the corresponding Coomassie-stained gel is shown as a loading control. The arrows indicate the position of the TMR-Star-labeled σK-SNAPCd fusion (expected size 47 kDa). The asterisk points to a possible degradation product of σK-SNAPCd (SNAPCd*) of about 25 kDa. The position of molecular mass markers (in kDa) is shown on the left side of the panels.

