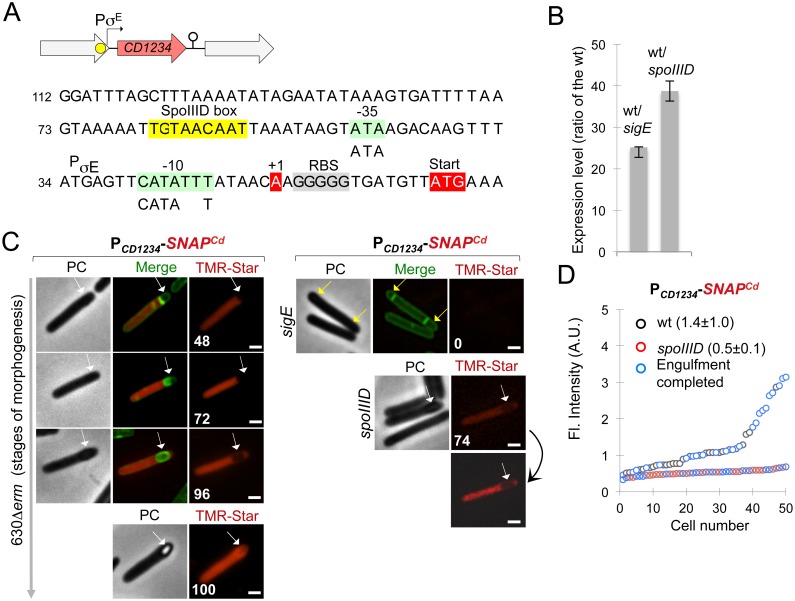
Fig 5. CD1234 is a mother cell-specific gene.
A: the panel represents the region of the CD1234 gene within the skinCd element (top) and the sequence of its promoter region (bottom). The transcriptional start site (+1, red), the -10 and -35 promoter elements (green) that match the consensus for the σE binding (represented below the sequence), and a putative SpoIIID binding site (yellow) are represented. B: qRT-PCR analysis of CD1234 transcription in strain 630Δerm (WT), and in sigE or spoIIID mutant. RNA was extracted from cells collected 14 h (sigE mutant) and 15 h (spoIIID mutant) after inoculation in liquid SM. Expression is represented as the fold ratio between the WT strain and the indicated mutants. Values are the average ± SD of two independent experiments. C: microscopy analysis of cells of the 630Δerm strain and of the sigE and spoIIID mutants carrying a PCD1234-SNAPCd transcriptional fusion. The cells were collected 24 h after inoculation in liquid SM, stained with TMR-Star and the membrane dye MTG, and examined by phase contrast (PC) and fluorescence microscopy. Merged images (MTG/TMR-Star) are not shown whenever the position of the forespore is clearly seen in the phase contrast images. The panels are representative of the expression patterns observed for different stages of sporulation, ordered from early to late. For the mutant strains, the morphological stage characteristic of each mutant is shown. The numbers in the panels refer to the percentage of cells at the represented stage showing SNAPCd fluorescence. The white arrows show the position of the developing spore in WT or spoIIID sporangia, and the yellow arrows the two-forespore compartments characteristic of a sigE mutant (disporic phenotype). Note that the TMR-Star panel for the spoIIID mutant is shown repeated with enhanced contrast (the two panels linked by a curved arrow) so that the lack of signal in the forespore is clearly seen. Scale bar, 1 μm. D: quantitative analysis of the fluorescence intensity in sporulating cells of the strains shown in C. The numbers in the legend represent the average ± SD of fluorescence intensity (50 cells were scored in each case) in the WT or spoIIID mutant. No difference was observed for sporangia before (black symbol in the curve for the WT and red symbols in the curve for the spoIIID mutant) or after engulfment completion (blue symbols in both curves).

