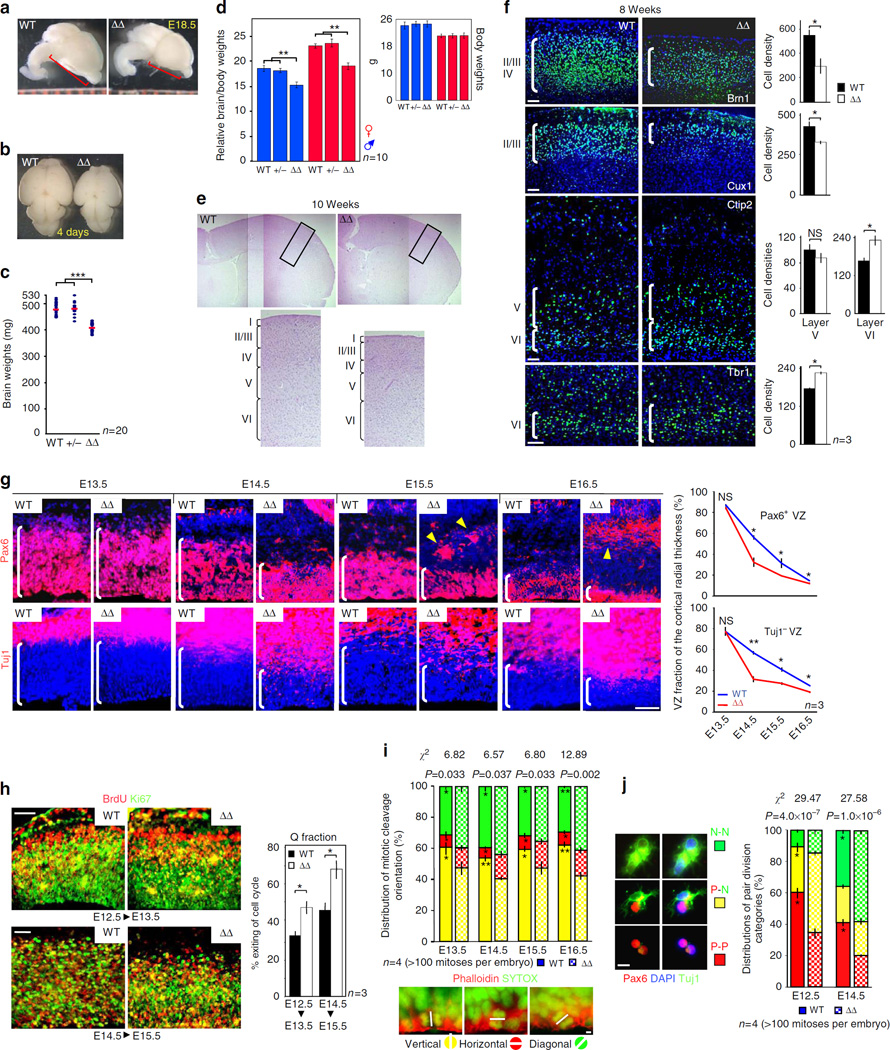
Figure 1. Thinning of outer cortical layers owing to premature exhaustion of NPC pool because of improper division.
(a,b) Dorsal and side views of embryo and newborn brains. (c) Distribution of 10 weeks brain weights of ASPMΔ mice and their WT and heterozygous littermates (n = 10 each gender). (d) Mean brain to body ratios and body weights. (e,f) Matching adult coronal cortical sections stained for H&E, Layer VI Tbr1 –, layers V-VI Ctip2 –, layers II-IV Brn1 –, and layers II–III Cux1 – neurons. Right bar graphs (f) demonstrate the cell density within each population. (g) Coronal cortical sections stained for Pax6 neural progenitor marker or Tuj1, which expressed exclusively in differentiated neurons. Right, graphs demonstrating the relative size of the Pax6+ – or Tuj1−-regions, expressed as fractions of the whole cortical wall radial thickness. For further discussion on the displaced Pax6+ foci located outside the VZ in E15.5 and E16.5 ASPMΔ cortices (arrowheads), see Supplementary Note 1. (h) Coronal cortical sections 24 h after BrdU pulse stained for BrdU and Ki67. The fractions of cells that exited the CC and were no longer dividing (BrdU+/Ki67−; red) presented as the percentage of total BrdU+ cells (red + yellow). (i) Representative axes of anaphase/telophase cortical mitotic divisions (white lines). The cleavage plane was defined as the orthogonal plane bisecting the line between the centers of each chromosome stained with SYTOX. Cell membrane was stained for phalloidin. (j) Panels show pairs of cells generated from a single progenitor 24 h after plating, stained for Pax6 and Tuj1. P-P; symmetric proliferative division produces a pair of precursors. P-N; asymmetric neurogenic division generates one precursor and one neuron. N-N; symmetric terminal neurogenic division generates two neurons. All graphs display mean ± s.e.m. χ2-squared statistical analyses show that distribution of ASPMΔ mitotic orientation and distribution of ASPMΔ mode of division are significantly different than control. *P < 0.05, **P < 0.005, ***P < 0.001 by Student’s t-test. Scale bars, 5 µm (i), 20 µm (j), 50 µm (f–h).

